Wells Fargo 2015 Annual Report Download - page 35
Download and view the complete annual report
Please find page 35 of the 2015 Wells Fargo annual report below. You can navigate through the pages in the report by either clicking on the pages listed below, or by using the keyword search tool below to find specific information within the annual report.-
 1
1 -
2
-
3
-
4
-
5
-
6
-
7
-
8
-
9
-
10
-
11
-
12
-
13
-
14
-
15
-
16
-
17
-
18
-
19
-
20
-
21
-
22
-
23
-
24
-
 25
25 -
 26
26 -
 27
27 -
 28
28 -
 29
29 -
 30
30 -
 31
31 -
 32
32 -
 33
33 -
 34
34 -
 35
35 -
 36
36 -
 37
37 -
 38
38 -
 39
39 -
 40
40 -
 41
41 -
 42
42 -
 43
43 -
 44
44 -
 45
45 -
46
-
47
-
48
-
49
-
50
-
51
-
52
-
53
-
54
-
55
-
56
-
57
-
58
-
59
-
60
-
61
-
62
-
63
-
64
-
65
-
66
-
67
-
68
-
69
-
70
-
71
-
72
-
73
-
74
-
75
-
76
-
77
-
78
-
79
-
80
-
81
-
82
-
83
-
84
-
85
-
86
-
87
-
88
-
89
-
90
-
91
-
92
-
93
-
94
-
95
-
96
-
97
-
98
-
99
-
100
-
101
-
102
-
103
-
104
-
105
-
106
-
107
-
108
-
109
-
110
-
111
-
112
-
113
-
114
-
115
-
116
-
117
-
118
-
119
-
120
-
121
-
122
-
123
-
124
-
125
-
126
-
127
-
128
-
129
-
130
-
131
-
132
-
133
-
134
-
135
-
136
-
137
-
138
-
139
-
140
-
141
-
142
-
143
-
144
-
145
-
146
-
147
-
148
-
149
-
150
-
151
-
152
-
153
-
154
-
155
-
156
-
157
-
158
-
159
-
160
-
161
-
162
-
163
-
164
-
165
-
166
-
167
-
168
-
169
-
170
-
171
-
172
-
173
-
174
-
175
-
176
-
177
-
178
-
179
-
180
-
181
-
182
-
183
-
184
-
185
-
186
-
187
-
188
-
189
-
190
-
191
-
192
-
193
-
194
-
195
-
196
-
197
-
198
-
199
-
200
-
201
-
202
-
203
-
204
-
205
-
206
-
207
-
208
-
209
-
210
-
211
-
212
-
213
-
214
-
215
-
216
-
217
-
218
-
219
-
220
-
221
-
222
-
223
-
224
-
225
-
226
-
227
-
228
-
229
-
230
-
231
-
232
-
233
-
234
-
235
-
236
-
237
-
238
-
239
-
240
-
241
-
242
-
243
-
244
-
245
-
246
-
247
-
248
-
249
-
250
-
251
-
252
-
253
-
254
-
255
-
256
-
257
-
258
-
259
-
260
-
261
-
262
-
263
-
264
-
265
-
266
-
267
-
268
-
269
-
270
-
271
-
272
-
273
 |
 |

2013
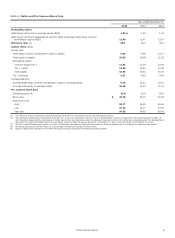
Table 2: Ratios and Per Common Share Data
Year ended December 31,
2015 2014
Profitability ratios
Wells Fargo net income to average assets (ROA) 1.31% 1.45 1.51
Wells Fargo net income applicable to common stock to average Wells Fargo common
stockholders' equity (ROE) 12.60 13.41 13.87
Efficiency ratio (1) 58.1 58.1 58.3
Capital ratios (2)(3)
At year end:
Wells Fargo common stockholders' equity to assets 9.62 9.86 10.17
Total equity to assets 10.85 10.98 11.22
Risk-based capital:
Common Equity Tier 1 11.07 11.04 10.82
Tier 1 capital 12.63 12.45 12.33
Total capital 15.45 15.53 15.43
Tier 1 leverage 9.37 9.45 9.60
Average balances:
Average Wells Fargo common stockholders' equity to average assets 9.78 10.22 10.41
Average total equity to average assets 10.99 11.32 11.41
Per common share data
Dividend payout (4) 35.8 32.9 29.6
Book value $ 33.78 32.19 29.48
Market price (5)
High 58.77 55.95 45.64
Low 47.75 44.17 34.43
Year end 54.36 54.82 45.40
(1) The efficiency ratio is noninterest expense divided by total revenue (net interest income and noninterest income).
(2) The risk-based capital ratios presented at December 31, 2015, were calculated under the lower of Standardized or Advanced Approach determined pursuant to Basel III
with Transition Requirements. Accordingly, the total capital ratio was calculated under the Advanced Approach and the other ratios were calculated under the Standardized
Approach. The risk-based capital ratios were calculated under the Basel III General Approach at December 31, 2014, and under Basel I at December 31, 2013.
(3) See the "Capital Management" section and Note 26 (Regulatory and Agency Capital Requirements) to Financial Statements in this Report for additional information.
(4) Dividends declared per common share as a percentage of diluted earnings per common share.
(5) Based on daily prices reported on the New York Stock Exchange Composite Transaction Reporting System.
Wells Fargo & Company
33