Wells Fargo 2015 Annual Report Download - page 68
Download and view the complete annual report
Please find page 68 of the 2015 Wells Fargo annual report below. You can navigate through the pages in the report by either clicking on the pages listed below, or by using the keyword search tool below to find specific information within the annual report.-
 1
1 -
2
-
3
-
4
-
5
-
6
-
7
-
8
-
9
-
10
-
11
-
12
-
13
-
14
-
15
-
16
-
17
-
18
-
19
-
20
-
21
-
22
-
23
-
24
-
25
-
26
-
27
-
28
-
29
-
30
-
31
-
32
-
33
-
34
-
35
-
36
-
37
-
38
-
39
-
40
-
41
-
42
-
43
-
44
-
45
-
46
-
47
-
48
-
49
-
50
-
51
-
52
-
53
-
54
-
55
-
56
-
57
-
 58
58 -
 59
59 -
 60
60 -
 61
61 -
 62
62 -
 63
63 -
 64
64 -
 65
65 -
 66
66 -
 67
67 -
 68
68 -
 69
69 -
 70
70 -
 71
71 -
 72
72 -
 73
73 -
 74
74 -
 75
75 -
 76
76 -
 77
77 -
 78
78 -
79
-
80
-
81
-
82
-
83
-
84
-
85
-
86
-
87
-
88
-
89
-
90
-
91
-
92
-
93
-
94
-
95
-
96
-
97
-
98
-
99
-
100
-
101
-
102
-
103
-
104
-
105
-
106
-
107
-
108
-
109
-
110
-
111
-
112
-
113
-
114
-
115
-
116
-
117
-
118
-
119
-
120
-
121
-
122
-
123
-
124
-
125
-
126
-
127
-
128
-
129
-
130
-
131
-
132
-
133
-
134
-
135
-
136
-
137
-
138
-
139
-
140
-
141
-
142
-
143
-
144
-
145
-
146
-
147
-
148
-
149
-
150
-
151
-
152
-
153
-
154
-
155
-
156
-
157
-
158
-
159
-
160
-
161
-
162
-
163
-
164
-
165
-
166
-
167
-
168
-
169
-
170
-
171
-
172
-
173
-
174
-
175
-
176
-
177
-
178
-
179
-
180
-
181
-
182
-
183
-
184
-
185
-
186
-
187
-
188
-
189
-
190
-
191
-
192
-
193
-
194
-
195
-
196
-
197
-
198
-
199
-
200
-
201
-
202
-
203
-
204
-
205
-
206
-
207
-
208
-
209
-
210
-
211
-
212
-
213
-
214
-
215
-
216
-
217
-
218
-
219
-
220
-
221
-
222
-
223
-
224
-
225
-
226
-
227
-
228
-
229
-
230
-
231
-
232
-
233
-
234
-
235
-
236
-
237
-
238
-
239
-
240
-
241
-
242
-
243
-
244
-
245
-
246
-
247
-
248
-
249
-
250
-
251
-
252
-
253
-
254
-
255
-
256
-
257
-
258
-
259
-
260
-
261
-
262
-
263
-
264
-
265
-
266
-
267
-
268
-
269
-
270
-
271
-
272
-
273
 |
 |

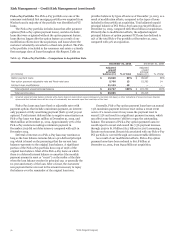
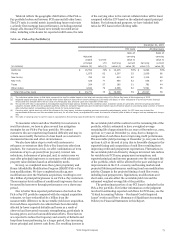
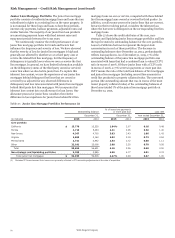
Risk Management – Credit Risk Management (continued)
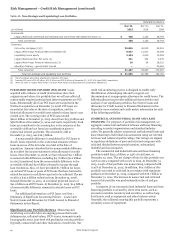
COMMERCIAL REAL ESTATE (CRE) We generally subject CRE
loans to individual risk assessment using our internal borrower
and collateral quality ratings. Our ratings are aligned to
regulatory definitions of pass and criticized categories with
criticized divided between special mention, substandard,
doubtful and loss categories. The CRE portfolio, which included
$8.8 billion of foreign CRE loans, totaled $144.3 billion, or 16%
of total loans, at December 31, 2015, and consisted of
$122.1 billion of mortgage loans and $22.2 billion of
construction loans.
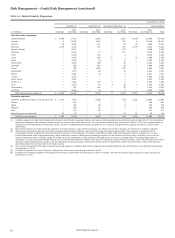
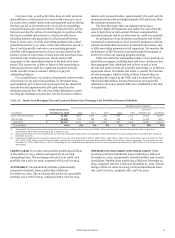
Table 20 summarizes CRE loans by state and property type
with the related nonaccrual totals. The portfolio is diversified
both geographically and by property type. The largest geographic
concentrations of combined CRE loans are in California, Texas,
New York and Florida, which combined represented 48% of the
Table 20: CRE Loans by State and Property Type
total CRE portfolio. By property type, the largest concentrations
are office buildings at 28% and apartments at 15% of the
portfolio. CRE nonaccrual loans totaled 0.7% of the CRE
outstanding balance at December 31, 2015, compared with 1.3%
at December 31, 2014. At December 31, 2015, we had $6.8 billion
of criticized CRE mortgage loans, down from $7.9 billion at
December 31, 2014, and $549 million of criticized CRE
construction loans, down from $949 million at December 31,
2014.
At December 31, 2015, the recorded investment in PCI CRE
loans totaled $634 million, down from $12.3 billion when
acquired at December 31, 2008, reflecting principal payments,
loan resolutions and write-downs.
December 31, 2015
Real estate mortgage Real estate construction Total % of
Nonaccrual Total Nonaccrual Total Nonaccrual Total total
(in millions) loans portfolio (1) loans portfolio (1) loans portfolio (1) loans
By state:
California $ 241 34,792 12 4,035 253 38,827 4%
Texas 62 9,001 — 1,885 62 10,886 1
New York 33 8,354 1 1,817 34 10,171 1
Florida 98 7,992 1 2,056 99 10,048 1
North Carolina 61 3,737 7 859 68 4,596 1
Arizona 54 3,922 1 575 55 4,497 *
Washington 30 3,451 — 816 30 4,267 *
Georgia 62 3,705 12 439 74 4,144 *
Virginia 13 2,813 — 981 13 3,794 *
Colorado 22 3,011 — 527 22 3,538 *
Other 293 41,382 32 8,174 325 49,556 (2) 5
Total $ 969 122,160 66 22,164 1,035 144,324 16%
By property:
Office buildings $ 252 37,621 — 3,104 252 40,725 4%
Apartments 30 14,034 — 7,559 30 21,593 2
Industrial/warehouse 156 13,815 — 1,262 156 15,077 2
Retail (excluding shopping center) 139 13,449 — 718 139 14,167 2
Shopping center 50 10,159 — 1,270 50 11,429 1
Hotel/motel 17 9,218 — 1,210 17 10,428 1
Real estate - other 110 10,126 — 232 110 10,358 1
Institutional 35 3,037 — 720 35 3,757 *
Land (excluding 1-4 family) 1 375 11 2,529 12 2,904 *
Agriculture 54 2,624 — 30 54 2,654 *
Other 125 7,702 55 3,530 180 11,232 1
Total $ 969 122,160 66 22,164 1,035 144,324 16%
* Less than 1%.
(1) Includes a total of $634 million PCI loans, consisting of $542 million of real estate mortgage and $92 million of real estate construction, which are considered to be
accruing due to the existence of the accretable yield and not based on consideration given to contractual interest payments.
(2) Includes 40 states; no state had loans in excess of $3.5 billion.
Wells Fargo & Company
66