Wells Fargo 2015 Annual Report Download - page 218
Download and view the complete annual report
Please find page 218 of the 2015 Wells Fargo annual report below. You can navigate through the pages in the report by either clicking on the pages listed below, or by using the keyword search tool below to find specific information within the annual report.-
 1
1 -
2
-
3
-
4
-
5
-
6
-
7
-
8
-
9
-
10
-
11
-
12
-
13
-
14
-
15
-
16
-
17
-
18
-
19
-
20
-
21
-
22
-
23
-
24
-
25
-
26
-
27
-
28
-
29
-
30
-
31
-
32
-
33
-
34
-
35
-
36
-
37
-
38
-
39
-
40
-
41
-
42
-
43
-
44
-
45
-
46
-
47
-
48
-
49
-
50
-
51
-
52
-
53
-
54
-
55
-
56
-
57
-
58
-
59
-
60
-
61
-
62
-
63
-
64
-
65
-
66
-
67
-
68
-
69
-
70
-
71
-
72
-
73
-
74
-
75
-
76
-
77
-
78
-
79
-
80
-
81
-
82
-
83
-
84
-
85
-
86
-
87
-
88
-
89
-
90
-
91
-
92
-
93
-
94
-
95
-
96
-
97
-
98
-
99
-
100
-
101
-
102
-
103
-
104
-
105
-
106
-
107
-
108
-
109
-
110
-
111
-
112
-
113
-
114
-
115
-
116
-
117
-
118
-
119
-
120
-
121
-
122
-
123
-
124
-
125
-
126
-
127
-
128
-
129
-
130
-
131
-
132
-
133
-
134
-
135
-
136
-
137
-
138
-
139
-
140
-
141
-
142
-
143
-
144
-
145
-
146
-
147
-
148
-
149
-
150
-
151
-
152
-
153
-
154
-
155
-
156
-
157
-
158
-
159
-
160
-
161
-
162
-
163
-
164
-
165
-
166
-
167
-
168
-
169
-
170
-
171
-
172
-
173
-
174
-
175
-
176
-
177
-
178
-
179
-
180
-
181
-
182
-
183
-
184
-
185
-
186
-
187
-
188
-
189
-
190
-
191
-
192
-
193
-
194
-
195
-
196
-
197
-
198
-
199
-
200
-
201
-
202
-
203
-
204
-
205
-
206
-
207
-
 208
208 -
 209
209 -
 210
210 -
 211
211 -
 212
212 -
 213
213 -
 214
214 -
 215
215 -
 216
216 -
 217
217 -
 218
218 -
 219
219 -
 220
220 -
 221
221 -
 222
222 -
 223
223 -
 224
224 -
 225
225 -
 226
226 -
 227
227 -
 228
228 -
229
-
230
-
231
-
232
-
233
-
234
-
235
-
236
-
237
-
238
-
239
-
240
-
241
-
242
-
243
-
244
-
245
-
246
-
247
-
248
-
249
-
250
-
251
-
252
-
253
-
254
-
255
-
256
-
257
-
258
-
259
-
260
-
261
-
262
-
263
-
264
-
265
-
266
-
267
-
268
-
269
-
270
-
271
-
272
-
273
 |
 |

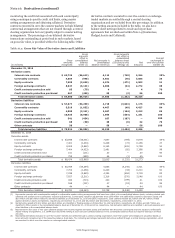
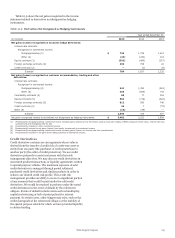
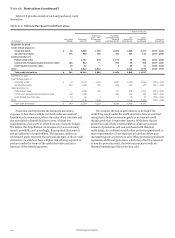
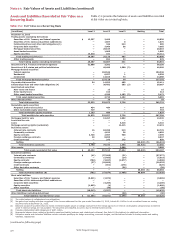
Note 17: Fair Values of Assets and Liabilities
We use fair value measurements to record fair value adjustments
to certain assets and liabilities and to determine fair value
disclosures. Assets and liabilities recorded at fair value on a
recurring basis are presented in the recurring table in this Note.
From time to time, we may be required to record at fair value
other assets on a nonrecurring basis, such as certain residential
and commercial MHFS, certain LHFS, loans held for investment,
nonmarketable equity investments and certain other assets.
These nonrecurring fair value adjustments typically involve
application of LOCOM accounting or write-downs of individual
assets.
Following is a discussion of the fair value hierarchy and the
valuation methodologies used for assets and liabilities recorded
at fair value on a recurring or nonrecurring basis and for
estimating fair value for financial instruments not recorded at
fair value.
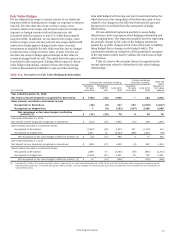
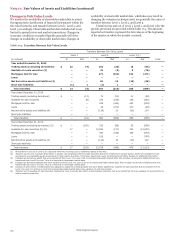
Fair Value Hierarchy
We group our assets and liabilities measured at fair value in
three levels based on the markets in which the assets and
liabilities are traded and the reliability of the assumptions used
to determine fair value. These levels are:
• Level 1 – Valuation is based upon quoted prices for identical
instruments traded in active markets.
• Level 2 – Valuation is based upon quoted prices for similar
instruments in active markets, quoted prices for identical or
similar instruments in markets that are not active, and
model-based valuation techniques for which all significant
assumptions are observable in the market.
• Level 3 – Valuation is generated from techniques that use
significant assumptions that are not observable in the
market. These unobservable assumptions reflect estimates
of assumptions that market participants would use in
pricing the asset or liability. Valuation techniques include
use of option pricing models, discounted cash flow models
and similar techniques.
In the determination of the classification of financial
instruments in Level 2 or Level 3 of the fair value hierarchy, we
consider all available information, including observable market
data, indications of market liquidity and orderliness, and our
understanding of the valuation techniques and significant inputs
used. For securities in inactive markets, we use a predetermined
percentage to evaluate the impact of fair value adjustments
derived from weighting both external and internal indications of
value to determine if the instrument is classified as Level 2 or
Level 3. Otherwise, the classification of Level 2 or Level 3 is
based upon the specific facts and circumstances of each
instrument or instrument category and judgments are made
regarding the significance of the Level 3 inputs to the
instruments’ fair value measurement in its entirety. If Level 3
inputs are considered significant, the instrument is classified as
Level 3.
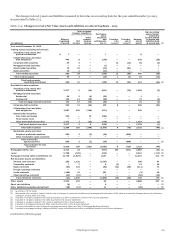
Assets
SHORT-TERM FINANCIAL ASSETS Short-term financial assets
include cash and due from banks, federal funds sold and
securities purchased under resale agreements and due from
customers on acceptances. These assets are carried at historical
cost. The carrying amount is a reasonable estimate of fair value
because of the relatively short time between the origination of
the instrument and its expected realization.
TRADING ASSETS (EXCLUDING DERIVATIVES) AND
INVESTMENT SECURITIES Trading assets and available-for-
sale securities are recorded at fair value on a recurring basis.
Other investment securities classified as held-to-maturity are
subject to impairment and fair value measurement if fair value
declines below amortized cost and we do not expect to recover
the entire amortized cost basis of the debt security. Fair value
measurement is based upon various sources of market pricing.
We use quoted prices in active markets, where available, and
classify such instruments within Level 1 of the fair value
hierarchy. Examples include exchange-traded equity securities
and some highly liquid government securities, such as U.S.
Treasuries. When instruments are traded in secondary markets
and quoted market prices do not exist for such securities, we
generally rely on internal valuation techniques or on prices
obtained from vendors (predominantly third-party pricing
services), and accordingly, we classify these instruments as Level
2 or 3.
Trading securities are mostly valued using internal trader
prices that are subject to price verification procedures performed
by separate internal personnel. The majority of fair values
derived using internal valuation techniques are verified against
multiple pricing sources, including prices obtained from third-
party vendors. Vendors compile prices from various sources and
often apply matrix pricing for similar securities when no price is
observable. We review pricing methodologies provided by the
vendors in order to determine if observable market information
is being used versus unobservable inputs. When evaluating the
appropriateness of an internal trader price compared with
vendor prices, considerations include the range and quality of
vendor prices. Vendor prices are used to ensure the
reasonableness of a trader price; however, valuing financial
instruments involves judgments acquired from knowledge of a
particular market. If a trader asserts that a vendor price is not
reflective of market value, justification for using the trader price,
including recent sales activity where possible, must be provided
to and approved by the appropriate levels of management.
Similarly, while investment securities traded in secondary
markets are typically valued using unadjusted vendor prices or
vendor prices adjusted by weighting them with internal
discounted cash flow techniques, these prices are reviewed and,
if deemed inappropriate by a trader who has the most knowledge
of a particular market, can be adjusted. These investment
securities, which include those measured using unadjusted
vendor prices, are generally classified as Level 2 and typically
involve using quoted market prices for the same or similar
securities, pricing models, discounted cash flow analyses using
significant inputs observable in the market where available or a
combination of multiple valuation techniques. Examples include
certain residential and commercial MBS, other asset-backed
securities municipal bonds, U.S. government and agency MBS,
and corporate debt securities.
Security fair value measurements using significant inputs
that are unobservable in the market due to limited activity or a
less liquid market are classified as Level 3 in the fair value
hierarchy. Such measurements include securities valued using
internal models or a combination of multiple valuation
techniques where the unobservable inputs are significant to the
overall fair value measurement. Securities classified as Level 3
include certain residential and commercial MBS, other asset-
backed securities, CDOs and certain CLOs, and certain residual
and retained interests in residential mortgage loan
Wells Fargo & Company
216