Wells Fargo 2015 Annual Report Download - page 104
Download and view the complete annual report
Please find page 104 of the 2015 Wells Fargo annual report below. You can navigate through the pages in the report by either clicking on the pages listed below, or by using the keyword search tool below to find specific information within the annual report.-
 1
1 -
2
-
3
-
4
-
5
-
6
-
7
-
8
-
9
-
10
-
11
-
12
-
13
-
14
-
15
-
16
-
17
-
18
-
19
-
20
-
21
-
22
-
23
-
24
-
25
-
26
-
27
-
28
-
29
-
30
-
31
-
32
-
33
-
34
-
35
-
36
-
37
-
38
-
39
-
40
-
41
-
42
-
43
-
44
-
45
-
46
-
47
-
48
-
49
-
50
-
51
-
52
-
53
-
54
-
55
-
56
-
57
-
58
-
59
-
60
-
61
-
62
-
63
-
64
-
65
-
66
-
67
-
68
-
69
-
70
-
71
-
72
-
73
-
74
-
75
-
76
-
77
-
78
-
79
-
80
-
81
-
82
-
83
-
84
-
85
-
86
-
87
-
88
-
89
-
90
-
91
-
92
-
93
-
 94
94 -
 95
95 -
 96
96 -
 97
97 -
 98
98 -
 99
99 -
 100
100 -
 101
101 -
 102
102 -
 103
103 -
 104
104 -
 105
105 -
 106
106 -
 107
107 -
 108
108 -
 109
109 -
 110
110 -
 111
111 -
 112
112 -
 113
113 -
 114
114 -
115
-
116
-
117
-
118
-
119
-
120
-
121
-
122
-
123
-
124
-
125
-
126
-
127
-
128
-
129
-
130
-
131
-
132
-
133
-
134
-
135
-
136
-
137
-
138
-
139
-
140
-
141
-
142
-
143
-
144
-
145
-
146
-
147
-
148
-
149
-
150
-
151
-
152
-
153
-
154
-
155
-
156
-
157
-
158
-
159
-
160
-
161
-
162
-
163
-
164
-
165
-
166
-
167
-
168
-
169
-
170
-
171
-
172
-
173
-
174
-
175
-
176
-
177
-
178
-
179
-
180
-
181
-
182
-
183
-
184
-
185
-
186
-
187
-
188
-
189
-
190
-
191
-
192
-
193
-
194
-
195
-
196
-
197
-
198
-
199
-
200
-
201
-
202
-
203
-
204
-
205
-
206
-
207
-
208
-
209
-
210
-
211
-
212
-
213
-
214
-
215
-
216
-
217
-
218
-
219
-
220
-
221
-
222
-
223
-
224
-
225
-
226
-
227
-
228
-
229
-
230
-
231
-
232
-
233
-
234
-
235
-
236
-
237
-
238
-
239
-
240
-
241
-
242
-
243
-
244
-
245
-
246
-
247
-
248
-
249
-
250
-
251
-
252
-
253
-
254
-
255
-
256
-
257
-
258
-
259
-
260
-
261
-
262
-
263
-
264
-
265
-
266
-
267
-
268
-
269
-
270
-
271
-
272
-
273
 |
 |

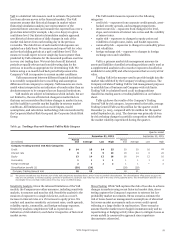
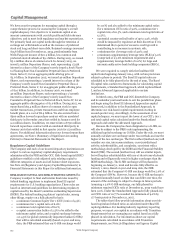
Capital Management
We have an active program for managing capital through a
comprehensive process for assessing the Company’s overall
capital adequacy. Our objective is to maintain capital at an
amount commensurate with our risk profile and risk tolerance
objectives, and to meet both regulatory and market expectations.
We primarily fund our capital needs through the retention of
earnings net of dividends as well as the issuance of preferred
stock and long and short-term debt. Retained earnings increased
$13.8 billion from December 31, 2014, predominantly from
Wells Fargo net income of $22.9 billion, less common and
preferred stock dividends of $9.1 billion. During 2015, we issued
85.2 million shares of common stock. In January 2015, we
issued 2 million Depositary Shares, each representing 1/25th
interest in a share of the Company’s newly issued 5.875% Fixed-
to-Floating Rate Non-Cumulative Perpetual Class A Preferred
Stock, Series U, for an aggregate public offering price of
$2.0 billion. In September 2015, we issued 40 million Depositary
Shares, each representing 1/1,000th interest in a share of the
Company’s newly issued Non-Cumulative Perpetual Class A
Preferred Stock, Series V, for an aggregate public offering price
of $1.0 billion. In addition, in January 2016, we issued
40 million Depositary Shares, each representing a 1/1,000th
interest in a share of the Company's newly issued Non-
Cumulative Perpetual Class A Preferred Stock, Series W, for an
aggregate public offering price of $1.0 billion. During 2015, we
repurchased 163.4 million shares of common stock in open
market transactions, private transactions and from employee
benefit plans, at a cost of $8.9 billion. We also entered into a
$500 million forward repurchase contract with an unrelated
third party in December 2015 that settled in January 2016 for
9.2 million shares. In addition, we entered into a $750 million
forward repurchase contract with an unrelated third party in
January 2016 that settled in first quarter 2016 for 15.9 million
shares. For additional information about our forward repurchase
agreements, see Note 1 (Summary of Significant Accounting
Policies) to Financial Statements in this Report.
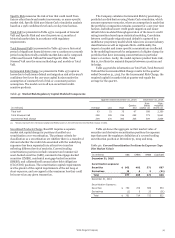
Regulatory Capital Guidelines
The Company and each of our insured depository institutions are
subject to various regulatory capital adequacy requirements
administered by the FRB and the OCC. Risk-based capital (RBC)
guidelines establish a risk-adjusted ratio relating capital to
different categories of assets and off-balance sheet exposures.
See Note 26 (Regulatory and Agency Capital Requirements) to
Financial Statements in this Report for additional information.
RISK-BASED CAPITAL AND RISK-WEIGHTED ASSETS The
Company is subject to final and interim final rules issued by
federal banking regulators to implement Basel III capital
requirements for U.S. banking organizations. These rules are
based on international guidelines for determining regulatory
capital issued by the Basel Committee on Banking Supervision
(BCBS). The federal banking regulators’ capital rules, among
other things, require on a fully phased-in basis:
• a minimum Common Equity Tier 1 (CET1) ratio of 4.5%;
• a minimum tier 1 capital ratio of 6.0%;
• a minimum total capital ratio of 8.0%;
• a capital conservation buffer of 2.5% to be added to the
minimum capital ratios, and a capital surcharge between
1.0-4.5% for global systemically important banks (G-SIBs)
that will be calculated annually (based on year-end 2014
data, the FRB estimated that our G-SIB surcharge would
be 2.0%) and also added to the minimum capital ratios
(for a minimum CET1 ratio of 9.0%, a minimum tier 1
capital ratio of 10.5%, and a minimum total capital ratio of
12.5%);
• a potential countercyclical buffer of up to 2.5%, which
would be imposed by regulators at their discretion if it is
determined that a period of excessive credit growth is
contributing to an increase in systemic risk;
• a minimum tier 1 leverage ratio of 4.0%; and
• a minimum supplementary leverage ratio (SLR) of 5.0%
(comprised of a 3.0% minimum requirement and a
supplementary leverage buffer of 2.0%) for large and
internationally active bank holding companies (BHCs).
We were required to comply with the final Basel III
capital rules beginning January 2014, with certain provisions
subject to phase-in periods. The Basel III capital rules are
scheduled to be fully phased in by the end of 2021. The Basel
III capital rules contain two frameworks for calculating capital
requirements, a Standardized Approach, which replaced Basel
I, and an Advanced Approach applicable to certain
institutions.
In March 2015, the FRB and OCC directed the Company
and its subsidiary national banks to exit the parallel run phase
and begin using the Basel III Advanced Approaches capital
framework, in addition to the Standardized Approach, to
determine our risk-based capital requirements starting in
second quarter 2015. Accordingly, in the assessment of our
capital adequacy, we must report the lower of our CET1, tier 1
and total capital ratios calculated under the Standardized
Approach and under the Advanced Approach.
Because the Company has been designated as a G-SIB, we
will also be subject to the FRB’s rule implementing the
additional capital surcharge on G-SIBs. Under the rule, we must
annually calculate our surcharge under two methods and use the
higher of the two surcharges. The first method (method one) will
consider our size, interconnectedness, cross-jurisdictional
activity, substitutability, and complexity, consistent with a
methodology developed by the BCBS and the Financial Stability
Board (FSB). The second (method two) will use similar inputs,
but will replace substitutability with use of short-term wholesale
funding and will generally result in higher surcharges than the
BCBS methodology. The G-SIB surcharge will be phased in
beginning on January 1, 2016 and become fully effective on
January 1, 2019. Based on year-end 2014 data, the FRB
estimated that the Company’s G-SIB surcharge would be 2.0% of
the Company’s RWAs. However, because the G-SIB surcharge is
calculated annually based on data that can differ over time, the
amount of the surcharge is subject to change in future periods.
Assuming a 2.0% G-SIB surcharge, our fully phased-in
minimum required CET1 ratio at December 31, 2015 would have
been 9.0%. Under the Standardized Approach (fully phased-in),
our CET1 ratio of 10.77% exceeded the minimum of 9.0% by
177 basis points at December 31, 2015.
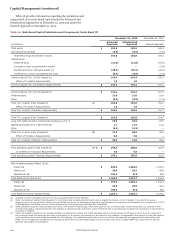
The tables that follow provide information about our risk-
based capital and related ratios as calculated under Basel III
capital guidelines. For banking industry regulatory reporting
purposes, we report our capital in accordance with Transition
Requirements but are managing our capital based on a fully
phased-in calculation. For information about our capital
requirements calculated in accordance with Transition
Requirements, see Note 26 (Regulatory and Agency Capital
Wells Fargo & Company
102