Wells Fargo 2015 Annual Report Download - page 239
Download and view the complete annual report
Please find page 239 of the 2015 Wells Fargo annual report below. You can navigate through the pages in the report by either clicking on the pages listed below, or by using the keyword search tool below to find specific information within the annual report.-
 1
1 -
2
-
3
-
4
-
5
-
6
-
7
-
8
-
9
-
10
-
11
-
12
-
13
-
14
-
15
-
16
-
17
-
18
-
19
-
20
-
21
-
22
-
23
-
24
-
25
-
26
-
27
-
28
-
29
-
30
-
31
-
32
-
33
-
34
-
35
-
36
-
37
-
38
-
39
-
40
-
41
-
42
-
43
-
44
-
45
-
46
-
47
-
48
-
49
-
50
-
51
-
52
-
53
-
54
-
55
-
56
-
57
-
58
-
59
-
60
-
61
-
62
-
63
-
64
-
65
-
66
-
67
-
68
-
69
-
70
-
71
-
72
-
73
-
74
-
75
-
76
-
77
-
78
-
79
-
80
-
81
-
82
-
83
-
84
-
85
-
86
-
87
-
88
-
89
-
90
-
91
-
92
-
93
-
94
-
95
-
96
-
97
-
98
-
99
-
100
-
101
-
102
-
103
-
104
-
105
-
106
-
107
-
108
-
109
-
110
-
111
-
112
-
113
-
114
-
115
-
116
-
117
-
118
-
119
-
120
-
121
-
122
-
123
-
124
-
125
-
126
-
127
-
128
-
129
-
130
-
131
-
132
-
133
-
134
-
135
-
136
-
137
-
138
-
139
-
140
-
141
-
142
-
143
-
144
-
145
-
146
-
147
-
148
-
149
-
150
-
151
-
152
-
153
-
154
-
155
-
156
-
157
-
158
-
159
-
160
-
161
-
162
-
163
-
164
-
165
-
166
-
167
-
168
-
169
-
170
-
171
-
172
-
173
-
174
-
175
-
176
-
177
-
178
-
179
-
180
-
181
-
182
-
183
-
184
-
185
-
186
-
187
-
188
-
189
-
190
-
191
-
192
-
193
-
194
-
195
-
196
-
197
-
198
-
199
-
200
-
201
-
202
-
203
-
204
-
205
-
206
-
207
-
208
-
209
-
210
-
211
-
212
-
213
-
214
-
215
-
216
-
217
-
218
-
219
-
220
-
221
-
222
-
223
-
224
-
225
-
226
-
227
-
228
-
 229
229 -
 230
230 -
 231
231 -
 232
232 -
 233
233 -
 234
234 -
 235
235 -
 236
236 -
 237
237 -
 238
238 -
 239
239 -
 240
240 -
 241
241 -
 242
242 -
 243
243 -
 244
244 -
 245
245 -
 246
246 -
 247
247 -
 248
248 -
 249
249 -
250
-
251
-
252
-
253
-
254
-
255
-
256
-
257
-
258
-
259
-
260
-
261
-
262
-
263
-
264
-
265
-
266
-
267
-
268
-
269
-
270
-
271
-
272
-
273
 |
 |

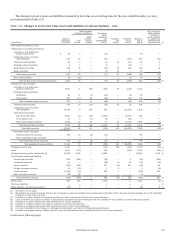
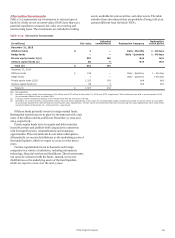
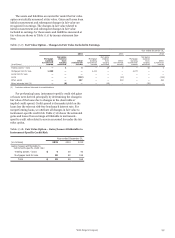
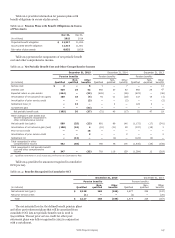
The assets and liabilities accounted for under the fair value
option are initially measured at fair value. Gains and losses from
initial measurement and subsequent changes in fair value are
recognized in earnings. The changes in fair value related to
initial measurement and subsequent changes in fair value
included in earnings for these assets and liabilities measured at
fair value are shown in Table 17.17 by income statement line
item.
Table 17.17: Fair Value Option – Changes in Fair Value Included in Earnings
Year ended December 31,
2015 2014 2013
(in millions)
Mortgage
banking
noninterest
income
Net gains
(losses)
from
trading
activities
Other
noninterest
income
Mortgage
banking
noninterest
income
Net gains
(losses)
from
trading
activities
Other
noninterest
income
Mortgage
banking
noninterest
income
Net gains
(losses)
from
trading
activities
Other
noninterest
income
Trading assets - loans $ — 4 4 — 29 4 — 40 3
Mortgages held for sale 1,808 — — 2,211 — — 2,073 — —
Loans held for sale — — — — — — — — —
Loans — — (122) — — (49) — — (216)
Other assets — — 457 — — 518 — — 324
Other interests held (1) — (6) — — (12) — — (15) —
(1) Includes retained interests in securitizations.
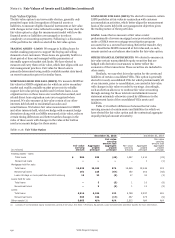
For performing loans, instrument-specific credit risk gains
or losses were derived principally by determining the change in
fair value of the loans due to changes in the observable or
implied credit spread. Credit spread is the market yield on the
loans less the relevant risk-free benchmark interest rate. For
nonperforming loans, we attribute all changes in fair value to
instrument-specific credit risk. Table 17.18 shows the estimated
gains and losses from earnings attributable to instrument-
specific credit risk related to assets accounted for under the fair
value option.
Table 17.18: Fair Value Option – Gains/Losses Attributable to
Instrument-Specific Credit Risk
Year ended December 31,
(in millions) 2015 2014 2013
Gains (losses) attributable to
instrument-specific credit risk:
Trading assets - loans
Mortgages held for sale
$ 4
29
29
60
40
126
Total $ 33 89 166
Wells Fargo & Company
237