Wells Fargo 2015 Annual Report Download - page 72
Download and view the complete annual report
Please find page 72 of the 2015 Wells Fargo annual report below. You can navigate through the pages in the report by either clicking on the pages listed below, or by using the keyword search tool below to find specific information within the annual report.-
 1
1 -
2
-
3
-
4
-
5
-
6
-
7
-
8
-
9
-
10
-
11
-
12
-
13
-
14
-
15
-
16
-
17
-
18
-
19
-
20
-
21
-
22
-
23
-
24
-
25
-
26
-
27
-
28
-
29
-
30
-
31
-
32
-
33
-
34
-
35
-
36
-
37
-
38
-
39
-
40
-
41
-
42
-
43
-
44
-
45
-
46
-
47
-
48
-
49
-
50
-
51
-
52
-
53
-
54
-
55
-
56
-
57
-
58
-
59
-
60
-
61
-
 62
62 -
 63
63 -
 64
64 -
 65
65 -
 66
66 -
 67
67 -
 68
68 -
 69
69 -
 70
70 -
 71
71 -
 72
72 -
 73
73 -
 74
74 -
 75
75 -
 76
76 -
 77
77 -
 78
78 -
 79
79 -
 80
80 -
 81
81 -
 82
82 -
83
-
84
-
85
-
86
-
87
-
88
-
89
-
90
-
91
-
92
-
93
-
94
-
95
-
96
-
97
-
98
-
99
-
100
-
101
-
102
-
103
-
104
-
105
-
106
-
107
-
108
-
109
-
110
-
111
-
112
-
113
-
114
-
115
-
116
-
117
-
118
-
119
-
120
-
121
-
122
-
123
-
124
-
125
-
126
-
127
-
128
-
129
-
130
-
131
-
132
-
133
-
134
-
135
-
136
-
137
-
138
-
139
-
140
-
141
-
142
-
143
-
144
-
145
-
146
-
147
-
148
-
149
-
150
-
151
-
152
-
153
-
154
-
155
-
156
-
157
-
158
-
159
-
160
-
161
-
162
-
163
-
164
-
165
-
166
-
167
-
168
-
169
-
170
-
171
-
172
-
173
-
174
-
175
-
176
-
177
-
178
-
179
-
180
-
181
-
182
-
183
-
184
-
185
-
186
-
187
-
188
-
189
-
190
-
191
-
192
-
193
-
194
-
195
-
196
-
197
-
198
-
199
-
200
-
201
-
202
-
203
-
204
-
205
-
206
-
207
-
208
-
209
-
210
-
211
-
212
-
213
-
214
-
215
-
216
-
217
-
218
-
219
-
220
-
221
-
222
-
223
-
224
-
225
-
226
-
227
-
228
-
229
-
230
-
231
-
232
-
233
-
234
-
235
-
236
-
237
-
238
-
239
-
240
-
241
-
242
-
243
-
244
-
245
-
246
-
247
-
248
-
249
-
250
-
251
-
252
-
253
-
254
-
255
-
256
-
257
-
258
-
259
-
260
-
261
-
262
-
263
-
264
-
265
-
266
-
267
-
268
-
269
-
270
-
271
-
272
-
273
 |
 |

Risk Management – Credit Risk Management (continued)
large numbers of properties in a short period of time using
market comparables and price trends for local market areas. The
primary risk associated with the use of AVMs is that the value of
an individual property may vary significantly from the average
for the market area. We have processes to periodically validate
AVMs and specific risk management guidelines addressing the
circumstances when AVMs may be used. AVMs are generally
used in underwriting to support property values on loan
originations only where the loan amount is under $250,000. We
generally require property visitation appraisals by a qualified
independent appraiser for larger residential property loans.
Additional information about AVMs and our policy for their use
can be found in Note 6 (Loans and Allowance for Credit Losses)
to Financial Statements in this Report.
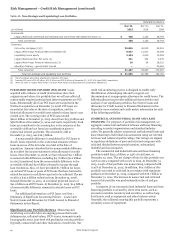
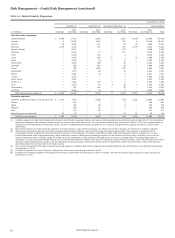
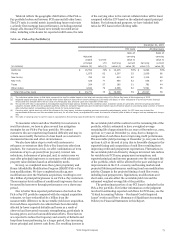
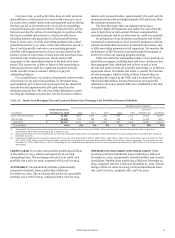
Table 23: Real Estate 1-4 Family First and Junior Lien
Mortgage Loans by State
December 31, 2015
Real
estate
Real 1-4 Total real
estate family estate
1-4 family junior 1-4 % of
first lien family total
(in millions) mortgage mortgage mortgage loans
Real estate 1-4 family
loans (excluding PCI):
California $ 88,367 14,554 102,921 11%
New York 20,962 2,416 23,378 3
Florida 14,068 4,823 18,891 2
New Jersey 11,825 4,462 16,287 2
Virginia 7,209 2,991 10,200 1
Texas 8,153 827 8,980 1
Pennsylvania 5,755 2,748 8,503 1
North Carolina 5,977 2,397 8,374 1
Washington 6,747 1,245 7,992 1
Other (1) 63,263 16,472 79,735 9
Government insured/
guaranteed loans (2) 22,353 — 22,353 2
Real estate 1-4 family
loans (excluding PCI) 254,679 52,935 307,614 34
Real estate 1-4 family
PCI loans (3) 19,190 69 19,259 2
Total $ 273,869 53,004 326,873 36%
(1) Consists of 41 states; no state had loans in excess of $7.2 billion.
(2) Represents loans whose repayments are predominantly insured by the Federal
Housing Administration (FHA) or guaranteed by the Department of Veterans
Affairs (VA).
(3) Includes $13.4 billion in real estate 1-4 family mortgage PCI loans in
California.
Wells Fargo & Company
70