Wells Fargo 2015 Annual Report Download - page 74
Download and view the complete annual report
Please find page 74 of the 2015 Wells Fargo annual report below. You can navigate through the pages in the report by either clicking on the pages listed below, or by using the keyword search tool below to find specific information within the annual report.-
 1
1 -
2
-
3
-
4
-
5
-
6
-
7
-
8
-
9
-
10
-
11
-
12
-
13
-
14
-
15
-
16
-
17
-
18
-
19
-
20
-
21
-
22
-
23
-
24
-
25
-
26
-
27
-
28
-
29
-
30
-
31
-
32
-
33
-
34
-
35
-
36
-
37
-
38
-
39
-
40
-
41
-
42
-
43
-
44
-
45
-
46
-
47
-
48
-
49
-
50
-
51
-
52
-
53
-
54
-
55
-
56
-
57
-
58
-
59
-
60
-
61
-
62
-
63
-
 64
64 -
 65
65 -
 66
66 -
 67
67 -
 68
68 -
 69
69 -
 70
70 -
 71
71 -
 72
72 -
 73
73 -
 74
74 -
 75
75 -
 76
76 -
 77
77 -
 78
78 -
 79
79 -
 80
80 -
 81
81 -
 82
82 -
 83
83 -
 84
84 -
85
-
86
-
87
-
88
-
89
-
90
-
91
-
92
-
93
-
94
-
95
-
96
-
97
-
98
-
99
-
100
-
101
-
102
-
103
-
104
-
105
-
106
-
107
-
108
-
109
-
110
-
111
-
112
-
113
-
114
-
115
-
116
-
117
-
118
-
119
-
120
-
121
-
122
-
123
-
124
-
125
-
126
-
127
-
128
-
129
-
130
-
131
-
132
-
133
-
134
-
135
-
136
-
137
-
138
-
139
-
140
-
141
-
142
-
143
-
144
-
145
-
146
-
147
-
148
-
149
-
150
-
151
-
152
-
153
-
154
-
155
-
156
-
157
-
158
-
159
-
160
-
161
-
162
-
163
-
164
-
165
-
166
-
167
-
168
-
169
-
170
-
171
-
172
-
173
-
174
-
175
-
176
-
177
-
178
-
179
-
180
-
181
-
182
-
183
-
184
-
185
-
186
-
187
-
188
-
189
-
190
-
191
-
192
-
193
-
194
-
195
-
196
-
197
-
198
-
199
-
200
-
201
-
202
-
203
-
204
-
205
-
206
-
207
-
208
-
209
-
210
-
211
-
212
-
213
-
214
-
215
-
216
-
217
-
218
-
219
-
220
-
221
-
222
-
223
-
224
-
225
-
226
-
227
-
228
-
229
-
230
-
231
-
232
-
233
-
234
-
235
-
236
-
237
-
238
-
239
-
240
-
241
-
242
-
243
-
244
-
245
-
246
-
247
-
248
-
249
-
250
-
251
-
252
-
253
-
254
-
255
-
256
-
257
-
258
-
259
-
260
-
261
-
262
-
263
-
264
-
265
-
266
-
267
-
268
-
269
-
270
-
271
-
272
-
273
 |
 |

Risk Management – Credit Risk Management (continued)
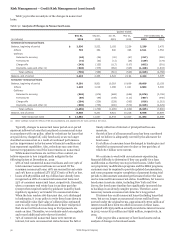
Pick-a-Pay Portfolio The Pick-a-Pay portfolio was one of the
consumer residential first mortgage portfolios we acquired from
Wachovia and a majority of the portfolio was identified as PCI
loans.
The Pick-a-Pay portfolio includes loans that offer payment
options (Pick-a-Pay option payment loans), and also includes
loans that were originated without the option payment feature,
loans that no longer offer the option feature as a result of our
modification efforts since the acquisition, and loans where the
customer voluntarily converted to a fixed-rate product. The Pick-
a-Pay portfolio is included in the consumer real estate 1-4 family
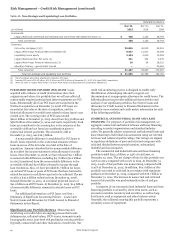
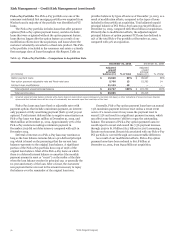
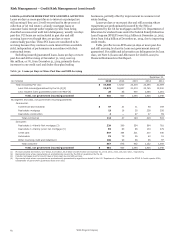
first mortgage class of loans throughout this Report. Table 25
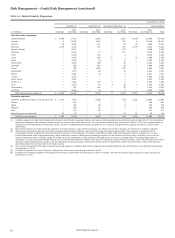
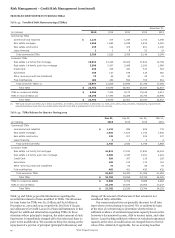
Table 25: Pick-a-Pay Portfolio – Comparison to Acquisition Date
provides balances by types of loans as of December 31, 2015, as a
result of modification efforts, compared to the types of loans
included in the portfolio at acquisition. Total adjusted unpaid
principal balance of PCI Pick-a-Pay loans was $23.8 billion at
December 31, 2015, compared with $61.0 billion at acquisition.
Primarily due to modification efforts, the adjusted unpaid
principal balance of option payment PCI loans has declined to
15% of the total Pick-a-Pay portfolio at December 31, 2015,
compared with 51% at acquisition.
December 31, 2015 December 31, 2008
Adjusted Adjusted
unpaid unpaid
principal principal
(in millions) balance (1) % of total balance (1) % of total
Option payment loans $ 16,828 39% $ 99,937 86%
Non-option payment adjustable-rate and fixed-rate loans 5,706 13 15,763 14
Full-term loan modifications 21,193 48 — —
Total adjusted unpaid principal balance $ 43,727 100% $ 115,700 100%
Total carrying value $ 39,065 $ 95,315
(1) Adjusted unpaid principal balance includes write-downs taken on loans where severe delinquency (normally 180 days) or other indications of severe borrower financial
stress exist that indicate there will be a loss of contractually due amounts upon final resolution of the loan.
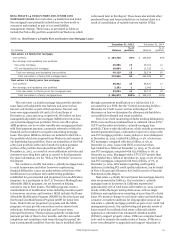
Pick-a-Pay loans may have fixed or adjustable rates with
payment options that include a minimum payment, an interest-
only payment or fully amortizing payment (both 15 and 30 year
options). Total interest deferred due to negative amortization on
Pick-a-Pay loans was $431 million at December 31, 2015, and
$606 million at December 31, 2014. Approximately 97% of the
Pick-a-Pay customers making a minimum payment in
December 2015 did not defer interest, compared with 95% in
December 2014.
Deferral of interest on a Pick-a-Pay loan may continue as
long as the loan balance remains below a pre-defined principal
cap, which is based on the percentage that the current loan
balance represents to the original loan balance. A significant
portion of the Pick-a-Pay portfolio has a cap of 125% of the
original loan balance. Most of the Pick-a-Pay loans on which
there is a deferred interest balance re-amortize (the monthly
payment amount is reset or “recast”) on the earlier of the date
when the loan balance reaches its principal cap, or generally the
10-year anniversary of the loan. After a recast, the customers’
new payment terms are reset to the amount necessary to repay
the balance over the remainder of the original loan term.
Generally, Pick-a-Pay option payment loans have an annual
7.5% maximum payment increase reset unless a recast event
occurs. If a recast occurs it may cause the payment reset to
exceed 7.5% and result in a significant payment increase, which
can affect some borrowers' ability to repay the outstanding
balance. The amount of Pick-a-Pay option payment loans we
would expect to recast and exceed the 7.5% payment increase
through 2020 is $1.8 billion ($1.2 billion for 2017) assuming a
flat rate environment. Recast risk associated with our Pick-a-Pay
PCI portfolio is covered through our nonaccretable difference.
As a result of our modification efforts, Pick-a-Pay option
payment loans have been reduced to $16.8 billion at
December 31, 2015, from $99.9 billion at acquisition.
Wells Fargo & Company
72