Wells Fargo 2015 Annual Report Download - page 78
Download and view the complete annual report
Please find page 78 of the 2015 Wells Fargo annual report below. You can navigate through the pages in the report by either clicking on the pages listed below, or by using the keyword search tool below to find specific information within the annual report.-
 1
1 -
2
-
3
-
4
-
5
-
6
-
7
-
8
-
9
-
10
-
11
-
12
-
13
-
14
-
15
-
16
-
17
-
18
-
19
-
20
-
21
-
22
-
23
-
24
-
25
-
26
-
27
-
28
-
29
-
30
-
31
-
32
-
33
-
34
-
35
-
36
-
37
-
38
-
39
-
40
-
41
-
42
-
43
-
44
-
45
-
46
-
47
-
48
-
49
-
50
-
51
-
52
-
53
-
54
-
55
-
56
-
57
-
58
-
59
-
60
-
61
-
62
-
63
-
64
-
65
-
66
-
67
-
 68
68 -
 69
69 -
 70
70 -
 71
71 -
 72
72 -
 73
73 -
 74
74 -
 75
75 -
 76
76 -
 77
77 -
 78
78 -
 79
79 -
 80
80 -
 81
81 -
 82
82 -
 83
83 -
 84
84 -
 85
85 -
 86
86 -
 87
87 -
 88
88 -
89
-
90
-
91
-
92
-
93
-
94
-
95
-
96
-
97
-
98
-
99
-
100
-
101
-
102
-
103
-
104
-
105
-
106
-
107
-
108
-
109
-
110
-
111
-
112
-
113
-
114
-
115
-
116
-
117
-
118
-
119
-
120
-
121
-
122
-
123
-
124
-
125
-
126
-
127
-
128
-
129
-
130
-
131
-
132
-
133
-
134
-
135
-
136
-
137
-
138
-
139
-
140
-
141
-
142
-
143
-
144
-
145
-
146
-
147
-
148
-
149
-
150
-
151
-
152
-
153
-
154
-
155
-
156
-
157
-
158
-
159
-
160
-
161
-
162
-
163
-
164
-
165
-
166
-
167
-
168
-
169
-
170
-
171
-
172
-
173
-
174
-
175
-
176
-
177
-
178
-
179
-
180
-
181
-
182
-
183
-
184
-
185
-
186
-
187
-
188
-
189
-
190
-
191
-
192
-
193
-
194
-
195
-
196
-
197
-
198
-
199
-
200
-
201
-
202
-
203
-
204
-
205
-
206
-
207
-
208
-
209
-
210
-
211
-
212
-
213
-
214
-
215
-
216
-
217
-
218
-
219
-
220
-
221
-
222
-
223
-
224
-
225
-
226
-
227
-
228
-
229
-
230
-
231
-
232
-
233
-
234
-
235
-
236
-
237
-
238
-
239
-
240
-
241
-
242
-
243
-
244
-
245
-
246
-
247
-
248
-
249
-
250
-
251
-
252
-
253
-
254
-
255
-
256
-
257
-
258
-
259
-
260
-
261
-
262
-
263
-
264
-
265
-
266
-
267
-
268
-
269
-
270
-
271
-
272
-
273
 |
 |

Risk Management – Credit Risk Management (continued)
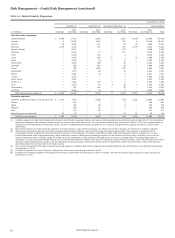
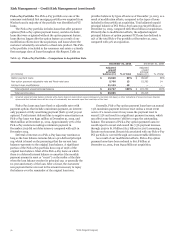
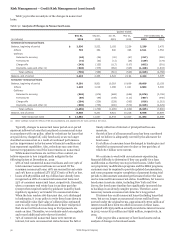
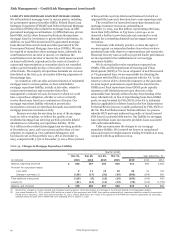
NONPERFORMING ASSETS (NONACCRUAL LOANS AND • for junior lien mortgages, we have evidence that the related
FORECLOSED ASSETS) Table 29 summarizes nonperforming first lien mortgage may be 120 days past due or in the
assets (NPAs) for each of the last five years. We generally place process of foreclosure regardless of the junior lien
loans on nonaccrual status when: delinquency status; or
• the full and timely collection of interest or principal • consumer real estate and auto loans are discharged in
becomes uncertain (generally based on an assessment of the bankruptcy, regardless of their delinquency status.
borrower’s financial condition and the adequacy of
collateral, if any); Note 1 (Summary of Significant Accounting Policies –
• they are 90 days (120 days with respect to real estate 1-4 Loans) to Financial Statements in this Report describes our
family first and junior lien mortgages) past due for interest accounting policy for nonaccrual and impaired loans.
or principal, unless both well-secured and in the process of
collection;
• part of the principal balance has been charged off;
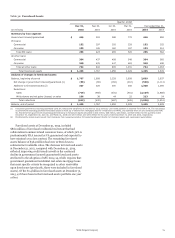
Table 29: Nonperforming Assets (Nonaccrual Loans and Foreclosed Assets)
December 31,
(in millions) 2015 2014 2013 2012 2011
Nonaccrual loans:
Commercial:
Commercial and industrial $ 1,363 538 775 1,467 2,167
Real estate mortgage 969 1,490 2,254 3,323 4,085
Real estate construction 66 187 416 1,003 1,890
Lease financing 26 24 30 29 55
Total commercial (1) 2,424 2,239 3,475 5,822 8,197
Consumer:
Real estate 1-4 family first mortgage (2) 7,293 8,583 9,799 11,456 10,932
Real estate 1-4 family junior lien mortgage 1,495 1,848 2,188 2,923 1,976
Automobile 121 137 173 245 159
Other revolving credit and installment 49 41 33 40 40
Total consumer (3) 8,958 10,609 12,193 14,664 13,107
Total nonaccrual loans (4)(5)(6) 11,382 12,848 15,668 20,486 21,304
As a percentage of total loans 1.24% 1.49 1.91 2.57 2.77
Foreclosed assets:
Government insured/guaranteed (7) $ 446 982 2,093 1,509 1,319
Non-government insured/guaranteed 979 1,627 1,844 2,514 3,342
Total foreclosed assets 1,425 2,609 3,937 4,023 4,661
Total nonperforming assets $ 12,807 15,457 19,605 24,509 25,965
As a percentage of total loans 1.40% 1.79 2.38 3.07 3.37
(1) Includes LHFS of $0 million, $1 million, $1 million, $16 million and $25 million at December 31, 2015, 2014, 2013, 2012 and 2011, respectively.
(2) Includes MHFS of $177 million, $177 million, $227 million, $336 million and $301 million at December 31, 2015, 2014, 2013, 2012, and 2011, respectively.
(3) December 31, 2012, includes the impact of the implementation of guidance issued by bank regulatory agencies in 2012.
(4) Excludes PCI loans because they continue to earn interest income from accretable yield, independent of performance in accordance with their contractual terms.
(5) Real estate 1-4 family mortgage loans predominantly insured by the FHA or guaranteed by the VA and student loans predominantly guaranteed by agencies on behalf of
the U.S. Department of Education under the Federal Family Education Loan Program are not placed on nonaccrual status because they are insured or guaranteed.
(6) See Note 6 (Loans and Allowance for Credit Losses) to Financial Statements in this Report for further information on impaired loans.
(7) During fourth quarter 2014, we adopted Accounting Standards Update (ASU) 2014-14, Classification of Certain Government-Guaranteed Mortgage Loans Upon Foreclosure,
effective as of January 1, 2014. This ASU requires that certain government guaranteed residential real estate mortgage loans that meet specific criteria be recognized as
other receivables upon foreclosure; previously, these assets were included in foreclosed assets. Government guaranteed residential real estate mortgage loans that
completed foreclosure during 2014 and met the criteria specified by ASU 2014-14 are excluded from this table and included in Accounts Receivable in Other Assets. For
more information on the changes in foreclosures for government guaranteed residential real estate mortgage loans, see Note 1 (Summary of Specific Accounting Policies)
and Note 7 (Premises, Equipment, Lease Commitments and Other Assets).
Wells Fargo & Company
76