Wells Fargo 2015 Annual Report Download - page 246
Download and view the complete annual report
Please find page 246 of the 2015 Wells Fargo annual report below. You can navigate through the pages in the report by either clicking on the pages listed below, or by using the keyword search tool below to find specific information within the annual report.-
 1
1 -
2
-
3
-
4
-
5
-
6
-
7
-
8
-
9
-
10
-
11
-
12
-
13
-
14
-
15
-
16
-
17
-
18
-
19
-
20
-
21
-
22
-
23
-
24
-
25
-
26
-
27
-
28
-
29
-
30
-
31
-
32
-
33
-
34
-
35
-
36
-
37
-
38
-
39
-
40
-
41
-
42
-
43
-
44
-
45
-
46
-
47
-
48
-
49
-
50
-
51
-
52
-
53
-
54
-
55
-
56
-
57
-
58
-
59
-
60
-
61
-
62
-
63
-
64
-
65
-
66
-
67
-
68
-
69
-
70
-
71
-
72
-
73
-
74
-
75
-
76
-
77
-
78
-
79
-
80
-
81
-
82
-
83
-
84
-
85
-
86
-
87
-
88
-
89
-
90
-
91
-
92
-
93
-
94
-
95
-
96
-
97
-
98
-
99
-
100
-
101
-
102
-
103
-
104
-
105
-
106
-
107
-
108
-
109
-
110
-
111
-
112
-
113
-
114
-
115
-
116
-
117
-
118
-
119
-
120
-
121
-
122
-
123
-
124
-
125
-
126
-
127
-
128
-
129
-
130
-
131
-
132
-
133
-
134
-
135
-
136
-
137
-
138
-
139
-
140
-
141
-
142
-
143
-
144
-
145
-
146
-
147
-
148
-
149
-
150
-
151
-
152
-
153
-
154
-
155
-
156
-
157
-
158
-
159
-
160
-
161
-
162
-
163
-
164
-
165
-
166
-
167
-
168
-
169
-
170
-
171
-
172
-
173
-
174
-
175
-
176
-
177
-
178
-
179
-
180
-
181
-
182
-
183
-
184
-
185
-
186
-
187
-
188
-
189
-
190
-
191
-
192
-
193
-
194
-
195
-
196
-
197
-
198
-
199
-
200
-
201
-
202
-
203
-
204
-
205
-
206
-
207
-
208
-
209
-
210
-
211
-
212
-
213
-
214
-
215
-
216
-
217
-
218
-
219
-
220
-
221
-
222
-
223
-
224
-
225
-
226
-
227
-
228
-
229
-
230
-
231
-
232
-
233
-
234
-
235
-
 236
236 -
 237
237 -
 238
238 -
 239
239 -
 240
240 -
 241
241 -
 242
242 -
 243
243 -
 244
244 -
 245
245 -
 246
246 -
 247
247 -
 248
248 -
 249
249 -
 250
250 -
 251
251 -
 252
252 -
 253
253 -
 254
254 -
 255
255 -
 256
256 -
257
-
258
-
259
-
260
-
261
-
262
-
263
-
264
-
265
-
266
-
267
-
268
-
269
-
270
-
271
-
272
-
273
 |
 |

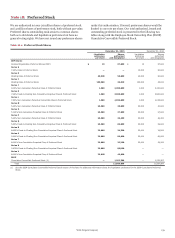
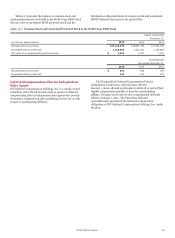
Note 19: Common Stock and Stock Plans (continued)
Stock Options Compensation Plans if originally issued under an employee plan,
Table 19.5 summarizes stock option activity and related and in the activity and related information for Director Awards if
information for the stock plans. Options assumed in mergers are originally issued under a director plan.
included in the activity and related information for Incentive
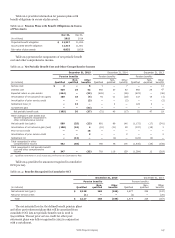
Table 19.5: Stock Option Activity
Number
Weighted-
average
exercise price
Weighted-
average
remaining
contractual
term (in yrs.)
Aggregate
intrinsic
value
(in millions)
Incentive compensation plans
Options outstanding as of December 31, 2014 97,663,200 $ 43.40
Canceled or forfeited (2,258,720) 238.54
Exercised (20,084,720) 30.63
Options exercisable and outstanding as of December 31, 2015 75,319,760 40.96 2.0 $ 1,956
Director awards
Options outstanding as of December 31, 2014 391,547 32.07
Exercised (84,657) 30.95
Options exercisable and outstanding as of December 31, 2015 306,890 32.37 1.5 7
The total intrinsic value of options exercised during 2015,
2014 and 2013 was $497 million, $805 million and $643 million,
respectively.
Cash received from the exercise of stock options for 2015,
2014 and 2013 was $618 million, $1.2 billion and $1.6 billion,
respectively.
We do not have a specific policy on repurchasing shares to
satisfy share option exercises. Rather, we have a general policy
on repurchasing shares to meet common stock issuance
requirements for our benefit plans (including share option
exercises), conversion of our convertible securities, acquisitions
and other corporate purposes. Various factors determine the
amount and timing of our share repurchases, including our
capital requirements, the number of shares we expect to issue for
acquisitions and employee benefit plans, market conditions
(including the trading price of our stock), and regulatory and
legal considerations. These factors can change at any time, and
there can be no assurance as to the number of shares we will
repurchase or when we will repurchase them.
The fair value of each option award granted on or after
January 1, 2006, is estimated using a Black-Scholes valuation
model. The expected term of reload options granted is generally
based on the midpoint between the valuation date and the
contractual termination date of the original option. Our expected
volatilities are based on a combination of the historical volatility
of our common stock and implied volatilities for traded options
on our common stock. The risk-free rate is based on the U.S.
Treasury zero-coupon yield curve in effect at the time of grant.
Both expected volatility and the risk-free rates are based on a
period commensurate with our expected term. The expected
dividend is based on a fixed dividend amount.
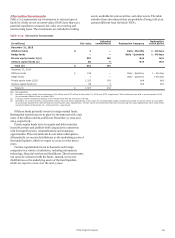
Table 19.6 presents the weighted-average per share fair value
of options granted and the assumptions used based on a Black-
Scholes option valuation model. All of the options granted in
2013 resulted from the reload feature.
Table 19.6: Weighted-Average Per Share Fair Value of Options
Granted
Year ended December 31,
2015 2014 2013
Per share fair value of options
granted $ — — 1.58
Expected volatility —% — 18.3
Expected dividends $ — — 0.93
Expected term (in years) — — 0.5
Risk-free interest rate —% — 0.1
Employee Stock Ownership Plan
The Wells Fargo & Company 401(k) Plan (401(k) Plan) is a
defined contribution plan with an Employee Stock Ownership
Plan (ESOP) feature. The ESOP feature enables the 401(k) Plan
to borrow money to purchase our preferred or common stock.
From 1994 through 2015, with the exception of 2009, we loaned
money to the 401(k) Plan to purchase shares of our ESOP
preferred stock. As our employer contributions are made to the
401(k) Plan and are used by the 401(k) Plan to make ESOP loan
payments, the ESOP preferred stock in the 401(k) Plan is
released and converted into our common stock shares.
Dividends on the common stock shares allocated as a result of
the release and conversion of the ESOP preferred stock reduce
retained earnings, and the shares are considered outstanding for
computing earnings per share. Dividends on the unallocated
ESOP preferred stock do not reduce retained earnings, and the
shares are not considered to be common stock equivalents for
computing earnings per share. Loan principal and interest
payments are made from our employer contributions to the 401
(k) Plan, along with dividends paid on the ESOP preferred stock.
With each principal and interest payment, a portion of the ESOP
preferred stock is released and converted to common stock
shares, which are allocated to the 401(k) Plan participants and
invested in the Wells Fargo ESOP Fund within the 401(k) Plan.
Wells Fargo & Company
244