Wells Fargo 2015 Annual Report Download - page 224
Download and view the complete annual report
Please find page 224 of the 2015 Wells Fargo annual report below. You can navigate through the pages in the report by either clicking on the pages listed below, or by using the keyword search tool below to find specific information within the annual report.-
 1
1 -
2
-
3
-
4
-
5
-
6
-
7
-
8
-
9
-
10
-
11
-
12
-
13
-
14
-
15
-
16
-
17
-
18
-
19
-
20
-
21
-
22
-
23
-
24
-
25
-
26
-
27
-
28
-
29
-
30
-
31
-
32
-
33
-
34
-
35
-
36
-
37
-
38
-
39
-
40
-
41
-
42
-
43
-
44
-
45
-
46
-
47
-
48
-
49
-
50
-
51
-
52
-
53
-
54
-
55
-
56
-
57
-
58
-
59
-
60
-
61
-
62
-
63
-
64
-
65
-
66
-
67
-
68
-
69
-
70
-
71
-
72
-
73
-
74
-
75
-
76
-
77
-
78
-
79
-
80
-
81
-
82
-
83
-
84
-
85
-
86
-
87
-
88
-
89
-
90
-
91
-
92
-
93
-
94
-
95
-
96
-
97
-
98
-
99
-
100
-
101
-
102
-
103
-
104
-
105
-
106
-
107
-
108
-
109
-
110
-
111
-
112
-
113
-
114
-
115
-
116
-
117
-
118
-
119
-
120
-
121
-
122
-
123
-
124
-
125
-
126
-
127
-
128
-
129
-
130
-
131
-
132
-
133
-
134
-
135
-
136
-
137
-
138
-
139
-
140
-
141
-
142
-
143
-
144
-
145
-
146
-
147
-
148
-
149
-
150
-
151
-
152
-
153
-
154
-
155
-
156
-
157
-
158
-
159
-
160
-
161
-
162
-
163
-
164
-
165
-
166
-
167
-
168
-
169
-
170
-
171
-
172
-
173
-
174
-
175
-
176
-
177
-
178
-
179
-
180
-
181
-
182
-
183
-
184
-
185
-
186
-
187
-
188
-
189
-
190
-
191
-
192
-
193
-
194
-
195
-
196
-
197
-
198
-
199
-
200
-
201
-
202
-
203
-
204
-
205
-
206
-
207
-
208
-
209
-
210
-
211
-
212
-
213
-
 214
214 -
 215
215 -
 216
216 -
 217
217 -
 218
218 -
 219
219 -
 220
220 -
 221
221 -
 222
222 -
 223
223 -
 224
224 -
 225
225 -
 226
226 -
 227
227 -
 228
228 -
 229
229 -
 230
230 -
 231
231 -
 232
232 -
 233
233 -
 234
234 -
235
-
236
-
237
-
238
-
239
-
240
-
241
-
242
-
243
-
244
-
245
-
246
-
247
-
248
-
249
-
250
-
251
-
252
-
253
-
254
-
255
-
256
-
257
-
258
-
259
-
260
-
261
-
262
-
263
-
264
-
265
-
266
-
267
-
268
-
269
-
270
-
271
-
272
-
273
 |
 |

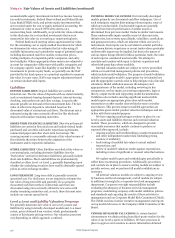
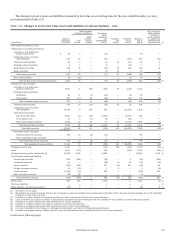
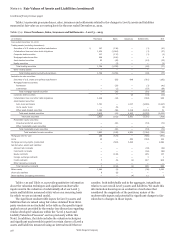
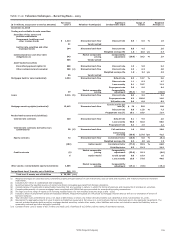
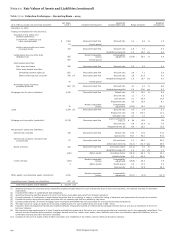
Note 17: Fair Values of Assets and Liabilities (continued)
Changes in Fair Value Levels availability of observable market data, which also may result in
We monitor the availability of observable market data to assess changing the valuation technique used, are generally the cause of
the appropriate classification of financial instruments within the transfers between Level 1, Level 2, and Level 3.
fair value hierarchy and transfer between Level 1, Level 2, and Transfers into and out of Level 1, Level 2, and Level 3 for the
Level 3 accordingly. Observable market data includes but is not periods presented are provided within Table 17.3. The amounts
limited to quoted prices and market transactions. Changes in reported as transfers represent the fair value as of the beginning
economic conditions or market liquidity generally will drive of the quarter in which the transfer occurred.
changes in availability of observable market data. Changes in
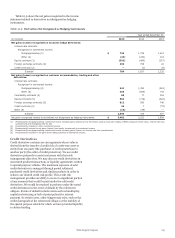
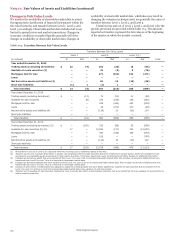
Table 17.3: Transfers Between Fair Value Levels
Transfers Between Fair Value Levels
Level 1 Level 2 Level 3 (1)
(in millions) In Out In Out In Out Total
Year ended December 31, 2015
Trading assets (excluding derivatives) $ 15 (9) 103 (28) 13 (94) —
Available-for-sale securities (2) — — 76 (8) 8 (76) —
Mortgages held for sale — — 471 (194) 194 (471) —
Loans — — — — — — —
Net derivative assets and liabilities (3) — — 48 15 (15) (48) —
Short sale liabilities (1) 1 (1) 1 — — —
Total transfers $ 14 (8) 697 (214) 200 (689) —
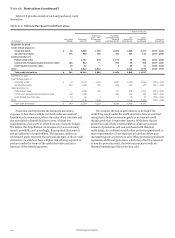
Year ended December 31, 2014
Trading assets (excluding derivatives) $ — (11) 70 (31) 31 (59) —
Available-for-sale securities — (8) 370 (148) 148 (362) —
Mortgages held for sale — — 229 (440) 440 (229) —
Loans — — 49 (270) 270 (49) —
Net derivative assets and liabilities (4) — — (134) 20 (20) 134 —
Short sale liabilities — — — — — — —
Total transfers $ — (19) 584 (869) 869 (565) —
Year ended December 31, 2013
Trading assets (excluding derivatives) (5) $ — (242) 535 (56) 52 (289) —
Available-for-sale securities (5) (6) 17 — 12,830 (117) 100 (12,830) —
Mortgages held for sale — — 343 (336) 336 (343) —
Loans — — 193 — — (193) —
Net derivative assets and liabilities (4) — — (142) 13 (13) 142 —
Short sale liabilities — — — — — — —
Total transfers $ 17 (242) 13,759 (496) 475 (13,513) —
(1) All transfers in and out of Level 3 are disclosed within the recurring Level 3 rollforward tables in this Note.
(2) Transfers out of Level 3 exclude $640 million in auction rate perpetual preferred equity securities that were transferred in second quarter 2015 from available-for-sale
securities to nonmarketable equity investments in other assets. See Note 7 (Premises, Equipment, Lease Commitments and Other Assets) for additional information.
(3) Includes net derivatives assets that were transferred from Level 3 to Level 2 due to increased observable market data. Also includes net derivative liabilities that were
transferred from Level 2 to Level 3 due to a decrease in observable market data.
(4) Includes net derivative liabilities that were transferred from Level 3 to Level 2 due to increased observable market data. Also includes net derivative liabilities that were
transferred from Level 2 to Level 3 due to a decrease in observable market data.
(5) Consists of $231 million of collateralized loan obligations classified as trading assets and $12.5 billion classified as available-for-sale securities that we transferred from
Level 3 to Level 2 in 2013 as a result of increased observable market data in the valuation of such instruments.
(6) Transfers out of available-for-sale securities classified as Level 3 exclude $6.0 billion in asset-backed securities that were transferred from the available-for-sale portfolio to
held-to-maturity securities.
Wells Fargo & Company
222