Wells Fargo 2015 Annual Report Download - page 97
Download and view the complete annual report
Please find page 97 of the 2015 Wells Fargo annual report below. You can navigate through the pages in the report by either clicking on the pages listed below, or by using the keyword search tool below to find specific information within the annual report.-
 1
1 -
2
-
3
-
4
-
5
-
6
-
7
-
8
-
9
-
10
-
11
-
12
-
13
-
14
-
15
-
16
-
17
-
18
-
19
-
20
-
21
-
22
-
23
-
24
-
25
-
26
-
27
-
28
-
29
-
30
-
31
-
32
-
33
-
34
-
35
-
36
-
37
-
38
-
39
-
40
-
41
-
42
-
43
-
44
-
45
-
46
-
47
-
48
-
49
-
50
-
51
-
52
-
53
-
54
-
55
-
56
-
57
-
58
-
59
-
60
-
61
-
62
-
63
-
64
-
65
-
66
-
67
-
68
-
69
-
70
-
71
-
72
-
73
-
74
-
75
-
76
-
77
-
78
-
79
-
80
-
81
-
82
-
83
-
84
-
85
-
86
-
 87
87 -
 88
88 -
 89
89 -
 90
90 -
 91
91 -
 92
92 -
 93
93 -
 94
94 -
 95
95 -
 96
96 -
 97
97 -
 98
98 -
 99
99 -
 100
100 -
 101
101 -
 102
102 -
 103
103 -
 104
104 -
 105
105 -
 106
106 -
 107
107 -
108
-
109
-
110
-
111
-
112
-
113
-
114
-
115
-
116
-
117
-
118
-
119
-
120
-
121
-
122
-
123
-
124
-
125
-
126
-
127
-
128
-
129
-
130
-
131
-
132
-
133
-
134
-
135
-
136
-
137
-
138
-
139
-
140
-
141
-
142
-
143
-
144
-
145
-
146
-
147
-
148
-
149
-
150
-
151
-
152
-
153
-
154
-
155
-
156
-
157
-
158
-
159
-
160
-
161
-
162
-
163
-
164
-
165
-
166
-
167
-
168
-
169
-
170
-
171
-
172
-
173
-
174
-
175
-
176
-
177
-
178
-
179
-
180
-
181
-
182
-
183
-
184
-
185
-
186
-
187
-
188
-
189
-
190
-
191
-
192
-
193
-
194
-
195
-
196
-
197
-
198
-
199
-
200
-
201
-
202
-
203
-
204
-
205
-
206
-
207
-
208
-
209
-
210
-
211
-
212
-
213
-
214
-
215
-
216
-
217
-
218
-
219
-
220
-
221
-
222
-
223
-
224
-
225
-
226
-
227
-
228
-
229
-
230
-
231
-
232
-
233
-
234
-
235
-
236
-
237
-
238
-
239
-
240
-
241
-
242
-
243
-
244
-
245
-
246
-
247
-
248
-
249
-
250
-
251
-
252
-
253
-
254
-
255
-
256
-
257
-
258
-
259
-
260
-
261
-
262
-
263
-
264
-
265
-
266
-
267
-
268
-
269
-
270
-
271
-
272
-
273
 |
 |

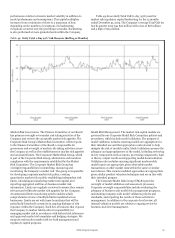
Specific Risk measures the risk of loss that could result from
factors other than broad market movements, or name-specific
market risk. Specific Risk uses Monte Carlo simulation analysis
based on a 99% confidence level and a 10-day time horizon.
Total VaR (as presented in Table 45) is composed of General
VaR and Specific Risk and uses the previous 12 months of
historical market data in accordance with regulatory
requirements.
Total Stressed VaR (as presented in Table 45) uses a historical
period of significant financial stress over a continuous 12 month
period using historically available market data and is composed
of Stressed General VaR and Stressed Specific Risk. Total
Stressed VaR uses the same methodology and models as Total
VaR.
Incremental Risk Charge (as presented in Table 45) captures
losses due to both issuer default and migration risk at the 99.9%
confidence level over the one-year capital horizon under the
assumption of constant level of risk or a constant position
assumption. The model covers all non-securitized credit-
sensitive products.
The Company calculates Incremental Risk by generating a
portfolio loss distribution using Monte Carlo simulation, which
assumes numerous scenarios, where an assumption is made that
the portfolio’s composition remains constant for a one-year time
horizon. Individual issuer credit grade migration and issuer
default risk is modeled through generation of the issuer’s credit
rating transition based upon statistical modeling. Correlation
between credit grade migration and default is captured by a
multifactor proprietary model which takes into account industry
classifications as well as regional effects. Additionally, the
impact of market and issuer specific concentrations is reflected
in the modeling framework by assignment of a higher charge for
portfolios that have increasing concentrations in particular
issuers or sectors. Lastly, the model captures product basis risk;
that is, it reflects the material disparity between a position and
its hedge.
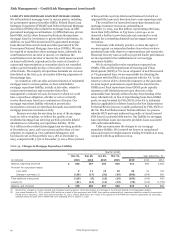
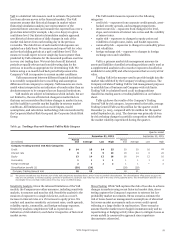
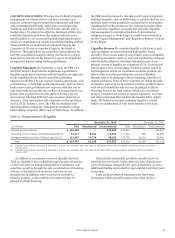
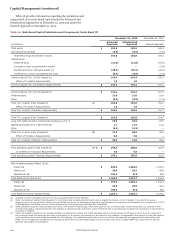
Table 45 provides information on Total VaR, Total Stressed
VaR and the Incremental Risk Charge results for the quarter
ended December 31, 2015. For the Incremental Risk Charge, the
required capital for market risk at quarter end equals the
average for the quarter.
Table 45: Market Risk Regulatory Capital Modeled Components
Quarter ended December 31, 2015 December 31, 2015
Risk- Risk-
Quarter based weighted
(in millions) Average Low High end capital (1) assets (1)
Total VaR 63 51 75 67 188 2,350
Total Stressed VaR 258 185 316 285 773 9,661
Incremental Risk Charge 309 270 393 305 309 3,864
(1) Results represent the risk-based capital and RWAs based on the VaR and Incremental Risk Charge models.
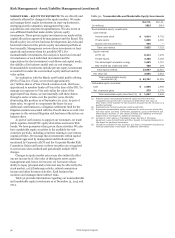
Securitized Products Charge Basel III requires a separate
market risk capital charge for positions classified as a
securitization or re-securitization. The primary criteria for
classification as a securitization are whether there is a transfer of
risk and whether the credit risk associated with the underlying
exposures has been separated into at least two tranches
reflecting different levels of seniority. Covered trading
securitizations positions include consumer and commercial
asset-backed securities (ABS), commercial mortgage-backed
securities (CMBS), residential mortgage-backed securities
(RMBS), and collateralized loan and other debt obligations
(CLO/CDO) positions. The securitization capital requirements
are the greater of the capital requirements of the net long or
short exposure, and are capped at the maximum loss that could
be incurred on any given transaction.
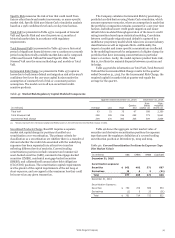
Table 46 shows the aggregate net fair market value of
securities and derivative securitization positions by exposure
type that meet the regulatory definition of a covered trading
securitization position at December 31, 2015 and 2014.
Table 46: Covered Securitization Positions by Exposure Type
(Net Market Value)
(in millions)
December 31, 2015
ABS CMBS RMBS CLO/CDO
Securitization exposure:
Securities
Derivatives
Total
$ 962
15
977
402
6
408
571
2
573
667
(21)
646
December 31, 2014
Securitization Exposure:
Securities
Derivatives
Total
$
$
752
(1)
751
709
5
714
689
23
712
553
(31)
522
Wells Fargo & Company
95