Wells Fargo 2015 Annual Report Download - page 238
Download and view the complete annual report
Please find page 238 of the 2015 Wells Fargo annual report below. You can navigate through the pages in the report by either clicking on the pages listed below, or by using the keyword search tool below to find specific information within the annual report.-
 1
1 -
2
-
3
-
4
-
5
-
6
-
7
-
8
-
9
-
10
-
11
-
12
-
13
-
14
-
15
-
16
-
17
-
18
-
19
-
20
-
21
-
22
-
23
-
24
-
25
-
26
-
27
-
28
-
29
-
30
-
31
-
32
-
33
-
34
-
35
-
36
-
37
-
38
-
39
-
40
-
41
-
42
-
43
-
44
-
45
-
46
-
47
-
48
-
49
-
50
-
51
-
52
-
53
-
54
-
55
-
56
-
57
-
58
-
59
-
60
-
61
-
62
-
63
-
64
-
65
-
66
-
67
-
68
-
69
-
70
-
71
-
72
-
73
-
74
-
75
-
76
-
77
-
78
-
79
-
80
-
81
-
82
-
83
-
84
-
85
-
86
-
87
-
88
-
89
-
90
-
91
-
92
-
93
-
94
-
95
-
96
-
97
-
98
-
99
-
100
-
101
-
102
-
103
-
104
-
105
-
106
-
107
-
108
-
109
-
110
-
111
-
112
-
113
-
114
-
115
-
116
-
117
-
118
-
119
-
120
-
121
-
122
-
123
-
124
-
125
-
126
-
127
-
128
-
129
-
130
-
131
-
132
-
133
-
134
-
135
-
136
-
137
-
138
-
139
-
140
-
141
-
142
-
143
-
144
-
145
-
146
-
147
-
148
-
149
-
150
-
151
-
152
-
153
-
154
-
155
-
156
-
157
-
158
-
159
-
160
-
161
-
162
-
163
-
164
-
165
-
166
-
167
-
168
-
169
-
170
-
171
-
172
-
173
-
174
-
175
-
176
-
177
-
178
-
179
-
180
-
181
-
182
-
183
-
184
-
185
-
186
-
187
-
188
-
189
-
190
-
191
-
192
-
193
-
194
-
195
-
196
-
197
-
198
-
199
-
200
-
201
-
202
-
203
-
204
-
205
-
206
-
207
-
208
-
209
-
210
-
211
-
212
-
213
-
214
-
215
-
216
-
217
-
218
-
219
-
220
-
221
-
222
-
223
-
224
-
225
-
226
-
227
-
 228
228 -
 229
229 -
 230
230 -
 231
231 -
 232
232 -
 233
233 -
 234
234 -
 235
235 -
 236
236 -
 237
237 -
 238
238 -
 239
239 -
 240
240 -
 241
241 -
 242
242 -
 243
243 -
 244
244 -
 245
245 -
 246
246 -
 247
247 -
 248
248 -
249
-
250
-
251
-
252
-
253
-
254
-
255
-
256
-
257
-
258
-
259
-
260
-
261
-
262
-
263
-
264
-
265
-
266
-
267
-
268
-
269
-
270
-
271
-
272
-
273
 |
 |

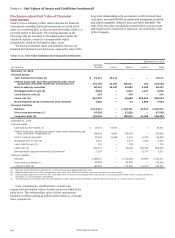
Note 17: Fair Values of Assets and Liabilities (continued)
Fair Value Option
The fair value option is an irrevocable election, generally only
permitted upon initial recognition of financial assets or
liabilities, to measure eligible financial instruments at fair value
with changes in fair value reflected in earnings. We may elect the
fair value option to align the measurement model with how the
financial assets or liabilities are managed or to reduce
complexity or accounting asymmetry. Following is a discussion
of the portfolios for which we elected the fair value option.
TRADING ASSETS - LOANS We engage in holding loans for
market-making purposes to support the buying and selling
demands of our customers. These loans are generally held for a
short period of time and managed within parameters of
internally approved market risk limits. We have elected to
measure and carry them at fair value, which best aligns with our
risk management practices. Fair value for these loans is
primarily determined using readily available market data based
on recent transaction prices for similar loans.
MORTGAGES HELD FOR SALE (MHFS) We measure MHFS at
fair value for MHFS originations for which an active secondary
market and readily available market prices exist to reliably
support fair value pricing models used for these loans. Loan
origination fees on these loans are recorded when earned, and
related direct loan origination costs are recognized when
incurred. We also measure at fair value certain of our other
interests held related to residential loan sales and
securitizations. We believe fair value measurement for MHFS
and other interests held, which we hedge with economic hedge
derivatives along with our MSRs measured at fair value, reduces
certain timing differences and better matches changes in the
value of these assets with changes in the value of derivatives
used as economic hedges for these assets.
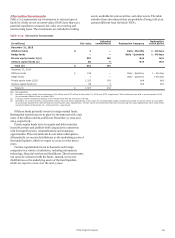
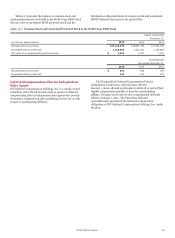
Table 17.16: Fair Value Option
LOANS HELD FOR SALE (LHFS) We elected to measure certain
LHFS portfolios at fair value in conjunction with customer
accommodation activities, which better aligns the measurement
basis of the assets held with our management objectives given
the trading nature of these portfolios.
LOANS Loans that we measure at fair value consist
predominantly of reverse mortgage loans previously transferred
under a GNMA reverse mortgage securitization program
accounted for as a secured borrowing. Before the transfer, they
were classified as MHFS measured at fair value and, as such,
remain carried on our balance sheet under the fair value option.
OTHER FINANCIAL INSTRUMENTS We elected to measure at
fair value certain nonmarketable equity securities that are
hedged with derivative instruments to better reflect the
economics of the transactions. These securities are included in
other assets.
Similarly, we may elect fair value option for the assets and
liabilities of certain consolidated VIEs. This option is generally
elected for newly consolidated VIEs for which predominantly all
of our interests, prior to consolidation, are carried at fair value
with changes in fair value recorded to earnings. Accordingly,
such an election allows us to continue fair value accounting
through earnings for those interests and eliminate income
statement mismatch otherwise caused by differences in the
measurement basis of the consolidated VIEs assets and
liabilities.
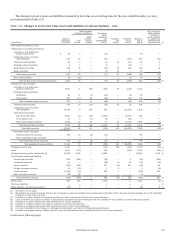
Table 17.16 reflects differences between the fair value
carrying amount of certain assets and liabilities for which we
have elected the fair value option and the contractual aggregate
unpaid principal amount at maturity.
December 31, 2015 December 31, 2014
Fair value Fair value
carrying carrying
amount less amount less
Fair value Aggregate aggregate Fair value Aggregate aggregate
carrying unpaid unpaid carrying unpaid unpaid
(in millions) amount principal principal amount principal principal
Trading assets - loans:
Total loans $ 886 935 (49) 1,387 1,410 (23)
Nonaccrual loans — — — — 1 (1)
Mortgages held for sale:
Total loans 13,539 13,265 274 15,565 15,246 319
Nonaccrual loans 161 228 (67) 160 252 (92)
Loans 90 days or more past due and still accruing 19 22 (3) 27 30 (3)
Loans held for sale:
Total loans — 5 (5) 1 10 (9)
Nonaccrual loans — 5 (5) 1 10 (9)
Loans:
Total loans 5,316 5,184 132 5,788 5,527 261
Nonaccrual loans 305 322 (17) 367 376 (9)
Other assets (1) 3,065 N/A N/A 2,512 N/A N/A
(1) Consists of nonmarketable equity investments carried at fair value. See Note 7 (Premises, Equipment, Lease Commitments and Other Assets) for more information.
Wells Fargo & Company
236