Wells Fargo 2015 Annual Report Download - page 223
Download and view the complete annual report
Please find page 223 of the 2015 Wells Fargo annual report below. You can navigate through the pages in the report by either clicking on the pages listed below, or by using the keyword search tool below to find specific information within the annual report.-
 1
1 -
2
-
3
-
4
-
5
-
6
-
7
-
8
-
9
-
10
-
11
-
12
-
13
-
14
-
15
-
16
-
17
-
18
-
19
-
20
-
21
-
22
-
23
-
24
-
25
-
26
-
27
-
28
-
29
-
30
-
31
-
32
-
33
-
34
-
35
-
36
-
37
-
38
-
39
-
40
-
41
-
42
-
43
-
44
-
45
-
46
-
47
-
48
-
49
-
50
-
51
-
52
-
53
-
54
-
55
-
56
-
57
-
58
-
59
-
60
-
61
-
62
-
63
-
64
-
65
-
66
-
67
-
68
-
69
-
70
-
71
-
72
-
73
-
74
-
75
-
76
-
77
-
78
-
79
-
80
-
81
-
82
-
83
-
84
-
85
-
86
-
87
-
88
-
89
-
90
-
91
-
92
-
93
-
94
-
95
-
96
-
97
-
98
-
99
-
100
-
101
-
102
-
103
-
104
-
105
-
106
-
107
-
108
-
109
-
110
-
111
-
112
-
113
-
114
-
115
-
116
-
117
-
118
-
119
-
120
-
121
-
122
-
123
-
124
-
125
-
126
-
127
-
128
-
129
-
130
-
131
-
132
-
133
-
134
-
135
-
136
-
137
-
138
-
139
-
140
-
141
-
142
-
143
-
144
-
145
-
146
-
147
-
148
-
149
-
150
-
151
-
152
-
153
-
154
-
155
-
156
-
157
-
158
-
159
-
160
-
161
-
162
-
163
-
164
-
165
-
166
-
167
-
168
-
169
-
170
-
171
-
172
-
173
-
174
-
175
-
176
-
177
-
178
-
179
-
180
-
181
-
182
-
183
-
184
-
185
-
186
-
187
-
188
-
189
-
190
-
191
-
192
-
193
-
194
-
195
-
196
-
197
-
198
-
199
-
200
-
201
-
202
-
203
-
204
-
205
-
206
-
207
-
208
-
209
-
210
-
211
-
212
-
 213
213 -
 214
214 -
 215
215 -
 216
216 -
 217
217 -
 218
218 -
 219
219 -
 220
220 -
 221
221 -
 222
222 -
 223
223 -
 224
224 -
 225
225 -
 226
226 -
 227
227 -
 228
228 -
 229
229 -
 230
230 -
 231
231 -
 232
232 -
 233
233 -
234
-
235
-
236
-
237
-
238
-
239
-
240
-
241
-
242
-
243
-
244
-
245
-
246
-
247
-
248
-
249
-
250
-
251
-
252
-
253
-
254
-
255
-
256
-
257
-
258
-
259
-
260
-
261
-
262
-
263
-
264
-
265
-
266
-
267
-
268
-
269
-
270
-
271
-
272
-
273
 |
 |

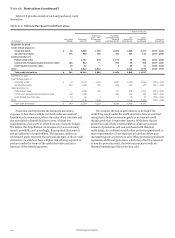
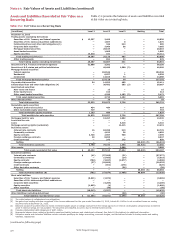
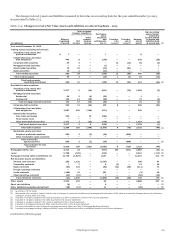
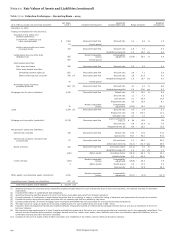
(continued from previous page)
(in millions) Level 1 Level 2 Level 3 Netting Total
December 31, 2014
Trading assets (excluding derivatives)
Securities of U.S. Treasury and federal agencies $ 10,506 3,886 — — 14,392
Securities of U.S. states and political subdivisions — 1,537 7 — 1,544
Collateralized loan and other debt obligations (1) — 274 445 — 719
Corporate debt securities — 7,517 54 — 7,571
Mortgage-backed securities — 16,273 — — 16,273
Asset-backed securities — 776 79 — 855
Equity securities 18,512 38 10 — 18,560
Total trading securities (2) 29,018 30,301 595 — 59,914
Other trading assets — 1,398 55 — 1,453
Total trading assets (excluding derivatives) 29,018 31,699 650 — 61,367
Securities of U.S. Treasury and federal agencies 19,899 5,905 — — 25,804
Securities of U.S. states and political subdivisions — 42,667 2,277 (3) — 44,944
Mortgage-backed securities:
Federal agencies — 110,089 — — 110,089
Residential — 9,245 24 — 9,269
Commercial — 16,885 109 — 16,994
Total mortgage-backed securities — 136,219 133 — 136,352
Corporate debt securities 83 14,451 252 — 14,786
Collateralized loan and other debt obligations (4) — 24,274 1,087 (3) — 25,361
Asset-backed securities:
Auto loans and leases — 31 245 (3) — 276
Home equity loans — 662 — — 662
Other asset-backed securities — 4,189 1,372 (3) — 5,561
Total asset-backed securities — 4,882 1,617 — 6,499
Other debt securities — 20 — — 20
Total debt securities 19,982 228,418 5,366 — 253,766
Marketable equity securities:
Perpetual preferred securities (5) 468 569 663 (3) — 1,700
Other marketable equity securities 1,952 24 — — 1,976
Total marketable equity securities 2,420 593 663 — 3,676
Total available-for-sale securities 22,402 229,011 6,029 — 257,442
Mortgages held for sale — 13,252 2,313 — 15,565
Loans held for sale — 1 — — 1
Loans — — 5,788 — 5,788
Mortgage servicing rights (residential) — — 12,738 — 12,738
Derivative assets:
Interest rate contracts 27 63,306 365 — 63,698
Commodity contracts — 7,438 23 — 7,461
Equity contracts 4,102 3,544 1,359 — 9,005
Foreign exchange contracts 65 7,339 — — 7,404
Credit contracts — 440 466 — 906
Netting — — — (65,869) (6) (65,869)
Total derivative assets (7) 4,194 82,067 2,213 (65,869) 22,605
Other assets — — 2,593 — 2,593
Total assets recorded at fair value $ 55,614 356,030 32,324 (65,869) 378,099
Derivative liabilities:
Interest rate contracts (29) (59,958) (72) — (60,059)
Commodity contracts — (7,680) (22) — (7,702)
Equity contracts (1,290) (4,305) (1,443) — (7,038)
Foreign exchange contracts (60) (7,767) — — (7,827)
Credit contracts — (456) (655) — (1,111)
Other derivative contracts — — (44) — (44)
Netting — — — 65,043 (6) 65,043
Total derivative liabilities (7) (1,379) (80,166) (2,236) 65,043 (18,738)
Short sale liabilities:
Securities of U.S. Treasury and federal agencies (7,043) (1,636) — — (8,679)
Securities of U.S. states and political subdivisions — (26) — — (26)
Corporate debt securities — (5,055) — — (5,055)
Equity securities (2,259) (2) — — (2,261)
Other securities — (73) (6) — (79)
Total short sale liabilities (9,302) (6,792) (6) — (16,100)
Other liabilities (excluding derivatives) — — (28) — (28)
Total liabilities recorded at fair value $ (10,681) (86,958) (2,270) 65,043 (34,866)
(1) The entire balance is collateralized loan obligations.
(2) Net gains from trading activities recognized in the income statement for the year ended December 31, 2014, include $211 million in net unrealized gains on trading
securities held at December 31, 2014.
(3) Balances consist of securities that are mostly investment grade based on ratings received from the ratings agencies or internal credit grades categorized as investment
grade if external ratings are not available. The securities are classified as Level 3 due to limited market activity.
(4) Includes collateralized debt obligations of $500 million.
(5) Perpetual preferred securities include ARS and corporate preferred securities. See Note 8 (Securitizations and Variable Interest Entities) for additional information.
(6) Represents balance sheet netting of derivative asset and liability balances and related cash collateral. See Note 16 (Derivatives) for additional information.
(7) Derivative assets and derivative liabilities include contracts qualifying for hedge accounting, economic hedges, and derivatives included in trading assets and trading
liabilities, respectively.
Wells Fargo & Company
221