Wells Fargo 2015 Annual Report Download - page 163
Download and view the complete annual report
Please find page 163 of the 2015 Wells Fargo annual report below. You can navigate through the pages in the report by either clicking on the pages listed below, or by using the keyword search tool below to find specific information within the annual report.-
 1
1 -
2
-
3
-
4
-
5
-
6
-
7
-
8
-
9
-
10
-
11
-
12
-
13
-
14
-
15
-
16
-
17
-
18
-
19
-
20
-
21
-
22
-
23
-
24
-
25
-
26
-
27
-
28
-
29
-
30
-
31
-
32
-
33
-
34
-
35
-
36
-
37
-
38
-
39
-
40
-
41
-
42
-
43
-
44
-
45
-
46
-
47
-
48
-
49
-
50
-
51
-
52
-
53
-
54
-
55
-
56
-
57
-
58
-
59
-
60
-
61
-
62
-
63
-
64
-
65
-
66
-
67
-
68
-
69
-
70
-
71
-
72
-
73
-
74
-
75
-
76
-
77
-
78
-
79
-
80
-
81
-
82
-
83
-
84
-
85
-
86
-
87
-
88
-
89
-
90
-
91
-
92
-
93
-
94
-
95
-
96
-
97
-
98
-
99
-
100
-
101
-
102
-
103
-
104
-
105
-
106
-
107
-
108
-
109
-
110
-
111
-
112
-
113
-
114
-
115
-
116
-
117
-
118
-
119
-
120
-
121
-
122
-
123
-
124
-
125
-
126
-
127
-
128
-
129
-
130
-
131
-
132
-
133
-
134
-
135
-
136
-
137
-
138
-
139
-
140
-
141
-
142
-
143
-
144
-
145
-
146
-
147
-
148
-
149
-
150
-
151
-
152
-
 153
153 -
 154
154 -
 155
155 -
 156
156 -
 157
157 -
 158
158 -
 159
159 -
 160
160 -
 161
161 -
 162
162 -
 163
163 -
 164
164 -
 165
165 -
 166
166 -
 167
167 -
 168
168 -
 169
169 -
 170
170 -
 171
171 -
 172
172 -
 173
173 -
174
-
175
-
176
-
177
-
178
-
179
-
180
-
181
-
182
-
183
-
184
-
185
-
186
-
187
-
188
-
189
-
190
-
191
-
192
-
193
-
194
-
195
-
196
-
197
-
198
-
199
-
200
-
201
-
202
-
203
-
204
-
205
-
206
-
207
-
208
-
209
-
210
-
211
-
212
-
213
-
214
-
215
-
216
-
217
-
218
-
219
-
220
-
221
-
222
-
223
-
224
-
225
-
226
-
227
-
228
-
229
-
230
-
231
-
232
-
233
-
234
-
235
-
236
-
237
-
238
-
239
-
240
-
241
-
242
-
243
-
244
-
245
-
246
-
247
-
248
-
249
-
250
-
251
-
252
-
253
-
254
-
255
-
256
-
257
-
258
-
259
-
260
-
261
-
262
-
263
-
264
-
265
-
266
-
267
-
268
-
269
-
270
-
271
-
272
-
273
 |
 |

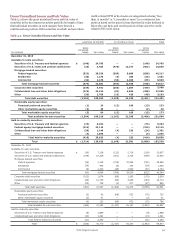
Other-Than-Temporarily Impaired Debt Securities
Table 5.9 shows the detail of OTTI write-downs on available-for-
sale debt securities included in earnings and the related changes
in OCI for the same securities.
Table 5.9: OTTI Write-downs Included in Earnings
Year ended December 31,
(in millions) 2015 2014 2013
OTTI on debt securities
Recorded as part of gross realized losses:
Credit-related OTTI $ 169 40 107
Intent-to-sell OTTI 14 9 51
Total recorded as part of gross realized losses 183 49 158
Changes to OCI for losses (reversal of losses) in non-credit-related OTTI (1):
Securities of U.S. states and political subdivisions (1) — (2)
Residential mortgage-backed securities (42) (10) (27)
Commercial mortgage-backed securities (16) (21) (90)
Corporate debt securities 12 — —
Collateralized loan and other debt obligations — — (1)
Other debt securities — — 1
Total changes to OCI for non-credit-related OTTI (47) (31) (119)
Total OTTI losses recorded on debt securities $ 136 18 39
(1) Represents amounts recorded to OCI for impairment, due to factors other than credit, on debt securities that have also had credit-related OTTI write-downs during the
period. Increases represent initial or subsequent non-credit-related OTTI on debt securities. Decreases represent partial to full reversal of impairment due to recoveries in
the fair value of securities due to non-credit factors.
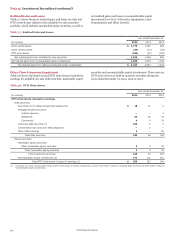
Table 5.10 presents a rollforward of the OTTI credit loss that represents the difference between the present value of expected
has been recognized in earnings as a write-down of available-for- future cash flows discounted using the security’s current
sale debt securities we still own (referred to as "credit-impaired" effective interest rate and the amortized cost basis of the security
debt securities) and do not intend to sell. Recognized credit loss prior to considering credit loss.
Table 5.10: Rollforward of OTTI Credit Loss
Year ended December 31,
(in millions) 2015 2014 2013
Credit loss recognized, beginning of year $ 1,025 1,171 1,289
Additions:
For securities with initial credit impairments 102 5 21
For securities with previous credit impairments 67 35 86
Total additions 169 40 107
Reductions:
For securities sold, matured, or intended/required to be sold (93) (169) (194)
For recoveries of previous credit impairments (1) (9) (17) (31)
Total reductions (102) (186) (225)
Credit loss recognized, end of year $ 1,092 1,025 1,171
(1) Recoveries of previous credit impairments result from increases in expected cash flows subsequent to credit loss recognition. Such recoveries are reflected prospectively as
interest yield adjustments using the effective interest method.
Wells Fargo & Company
161