Wells Fargo 2015 Annual Report Download - page 171
Download and view the complete annual report
Please find page 171 of the 2015 Wells Fargo annual report below. You can navigate through the pages in the report by either clicking on the pages listed below, or by using the keyword search tool below to find specific information within the annual report.-
 1
1 -
2
-
3
-
4
-
5
-
6
-
7
-
8
-
9
-
10
-
11
-
12
-
13
-
14
-
15
-
16
-
17
-
18
-
19
-
20
-
21
-
22
-
23
-
24
-
25
-
26
-
27
-
28
-
29
-
30
-
31
-
32
-
33
-
34
-
35
-
36
-
37
-
38
-
39
-
40
-
41
-
42
-
43
-
44
-
45
-
46
-
47
-
48
-
49
-
50
-
51
-
52
-
53
-
54
-
55
-
56
-
57
-
58
-
59
-
60
-
61
-
62
-
63
-
64
-
65
-
66
-
67
-
68
-
69
-
70
-
71
-
72
-
73
-
74
-
75
-
76
-
77
-
78
-
79
-
80
-
81
-
82
-
83
-
84
-
85
-
86
-
87
-
88
-
89
-
90
-
91
-
92
-
93
-
94
-
95
-
96
-
97
-
98
-
99
-
100
-
101
-
102
-
103
-
104
-
105
-
106
-
107
-
108
-
109
-
110
-
111
-
112
-
113
-
114
-
115
-
116
-
117
-
118
-
119
-
120
-
121
-
122
-
123
-
124
-
125
-
126
-
127
-
128
-
129
-
130
-
131
-
132
-
133
-
134
-
135
-
136
-
137
-
138
-
139
-
140
-
141
-
142
-
143
-
144
-
145
-
146
-
147
-
148
-
149
-
150
-
151
-
152
-
153
-
154
-
155
-
156
-
157
-
158
-
159
-
160
-
 161
161 -
 162
162 -
 163
163 -
 164
164 -
 165
165 -
 166
166 -
 167
167 -
 168
168 -
 169
169 -
 170
170 -
 171
171 -
 172
172 -
 173
173 -
 174
174 -
 175
175 -
 176
176 -
 177
177 -
 178
178 -
 179
179 -
 180
180 -
 181
181 -
182
-
183
-
184
-
185
-
186
-
187
-
188
-
189
-
190
-
191
-
192
-
193
-
194
-
195
-
196
-
197
-
198
-
199
-
200
-
201
-
202
-
203
-
204
-
205
-
206
-
207
-
208
-
209
-
210
-
211
-
212
-
213
-
214
-
215
-
216
-
217
-
218
-
219
-
220
-
221
-
222
-
223
-
224
-
225
-
226
-
227
-
228
-
229
-
230
-
231
-
232
-
233
-
234
-
235
-
236
-
237
-
238
-
239
-
240
-
241
-
242
-
243
-
244
-
245
-
246
-
247
-
248
-
249
-
250
-
251
-
252
-
253
-
254
-
255
-
256
-
257
-
258
-
259
-
260
-
261
-
262
-
263
-
264
-
265
-
266
-
267
-
268
-
269
-
270
-
271
-
272
-
273
 |
 |

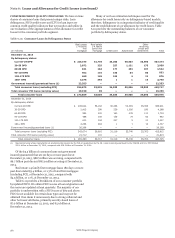
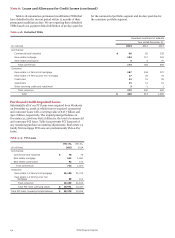
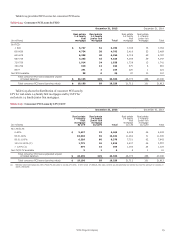
Table 6.11: Consumer Loans by FICO
Real estate Real estate Other
(in millions)
1-4 family
first
mortgage
1-4 family
junior lien
mortgage Credit card Automobile
revolving
credit and
installment Total
December 31, 2015
By updated FICO:
< 600 $ 8,716 3,025 2,927 9,260 965 24,893
600-639 6,961 2,367 2,875 6,619 1,086 19,908
640-679 13,006 4,613 5,354 10,014 2,416 35,403
680-719 24,460 7,863 6,857 10,947 4,388 54,515
720-759 38,309 10,966 7,017 8,279 6,010 70,581
760-799 92,975 16,369 5,693 7,761 8,351 131,149
800+ 44,452 6,895 3,090 6,654 6,510 67,601
No FICO available 3,447 837 226 432 2,395 7,337
FICO not required — — — — 6,977 6,977
Government insured/guaranteed loans (1) 22,353 — — — — 22,353
Total consumer loans (excluding PCI) 254,679 52,935 34,039 59,966 39,098 440,717
Total consumer PCI loans (carrying value) 19,190 69 — — — 19,259
Total consumer loans $ 273,869 53,004 34,039 59,966 39,098 459,976
December 31, 2014
By updated FICO:
< 600 $ 11,166 4,001 2,639 8,825 894 27,525
600-639 7,866 2,794 2,588 6,236 1,058 20,542
640-679 13,894 5,324 4,931 9,352 2,366 35,867
680-719 24,412 8,970 6,285 9,994 4,389 54,050
720-759 35,490 12,171 6,407 7,475 5,896 67,439
760-799 82,123 17,897 5,234 7,315 7,673 120,242
800+ 39,219 7,581 2,758 6,184 5,819 61,561
No FICO available 3,236 878 277 359 1,814 6,564
FICO not required — — — — 5,854 5,854
Government insured/guaranteed loans (1) 26,268 — — — — 26,268
Total consumer loans (excluding PCI) 243,674 59,616 31,119 55,740 35,763 425,912
Total consumer PCI loans (carrying value) 21,712 101 — — — 21,813
Total consumer loans $ 265,386 59,717 31,119 55,740 35,763 447,725
(1) Represents loans whose repayments are predominantly insured by the FHA or guaranteed by the VA.
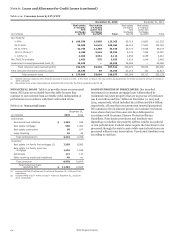
LTV refers to the ratio comparing the loan’s unpaid
principal balance to the property’s collateral value. CLTV refers
to the combination of first mortgage and junior lien mortgage
(including unused line amounts for credit line products) ratios.
LTVs and CLTVs are updated quarterly using a cascade approach
which first uses values provided by automated valuation models
(AVMs) for the property. If an AVM is not available, then the
value is estimated using the original appraised value adjusted by
the change in Home Price Index (HPI) for the property location.
If an HPI is not available, the original appraised value is used.
The HPI value is normally the only method considered for high
value properties, generally with an original value of $1 million or
more, as the AVM values have proven less accurate for these
properties.
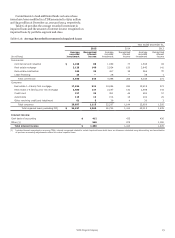
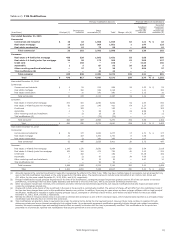
Table 6.12 shows the most updated LTV and CLTV
distribution of the real estate 1-4 family first and junior lien
mortgage loan portfolios. We consider the trends in residential
real estate markets as we monitor credit risk and establish our
allowance for credit losses. In the event of a default, any loss
should be limited to the portion of the loan amount in excess of
the net realizable value of the underlying real estate collateral
value. Certain loans do not have an LTV or CLTV primarily due
to industry data availability and portfolios acquired from or
serviced by other institutions.
Wells Fargo & Company
169