Wells Fargo 2015 Annual Report Download - page 56
Download and view the complete annual report
Please find page 56 of the 2015 Wells Fargo annual report below. You can navigate through the pages in the report by either clicking on the pages listed below, or by using the keyword search tool below to find specific information within the annual report.-
 1
1 -
2
-
3
-
4
-
5
-
6
-
7
-
8
-
9
-
10
-
11
-
12
-
13
-
14
-
15
-
16
-
17
-
18
-
19
-
20
-
21
-
22
-
23
-
24
-
25
-
26
-
27
-
28
-
29
-
30
-
31
-
32
-
33
-
34
-
35
-
36
-
37
-
38
-
39
-
40
-
41
-
42
-
43
-
44
-
45
-
 46
46 -
 47
47 -
 48
48 -
 49
49 -
 50
50 -
 51
51 -
 52
52 -
 53
53 -
 54
54 -
 55
55 -
 56
56 -
 57
57 -
 58
58 -
 59
59 -
 60
60 -
 61
61 -
 62
62 -
 63
63 -
 64
64 -
 65
65 -
 66
66 -
67
-
68
-
69
-
70
-
71
-
72
-
73
-
74
-
75
-
76
-
77
-
78
-
79
-
80
-
81
-
82
-
83
-
84
-
85
-
86
-
87
-
88
-
89
-
90
-
91
-
92
-
93
-
94
-
95
-
96
-
97
-
98
-
99
-
100
-
101
-
102
-
103
-
104
-
105
-
106
-
107
-
108
-
109
-
110
-
111
-
112
-
113
-
114
-
115
-
116
-
117
-
118
-
119
-
120
-
121
-
122
-
123
-
124
-
125
-
126
-
127
-
128
-
129
-
130
-
131
-
132
-
133
-
134
-
135
-
136
-
137
-
138
-
139
-
140
-
141
-
142
-
143
-
144
-
145
-
146
-
147
-
148
-
149
-
150
-
151
-
152
-
153
-
154
-
155
-
156
-
157
-
158
-
159
-
160
-
161
-
162
-
163
-
164
-
165
-
166
-
167
-
168
-
169
-
170
-
171
-
172
-
173
-
174
-
175
-
176
-
177
-
178
-
179
-
180
-
181
-
182
-
183
-
184
-
185
-
186
-
187
-
188
-
189
-
190
-
191
-
192
-
193
-
194
-
195
-
196
-
197
-
198
-
199
-
200
-
201
-
202
-
203
-
204
-
205
-
206
-
207
-
208
-
209
-
210
-
211
-
212
-
213
-
214
-
215
-
216
-
217
-
218
-
219
-
220
-
221
-
222
-
223
-
224
-
225
-
226
-
227
-
228
-
229
-
230
-
231
-
232
-
233
-
234
-
235
-
236
-
237
-
238
-
239
-
240
-
241
-
242
-
243
-
244
-
245
-
246
-
247
-
248
-
249
-
250
-
251
-
252
-
253
-
254
-
255
-
256
-
257
-
258
-
259
-
260
-
261
-
262
-
263
-
264
-
265
-
266
-
267
-
268
-
269
-
270
-
271
-
272
-
273
 |
 |

Balance Sheet Analysis (continued)
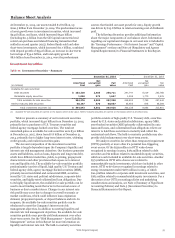
At December 31, 2015, investment securities included
$52.2 billion of municipal bonds, of which 93.9% were rated “A-”
or better based predominantly on external and, in some cases,
internal ratings. Additionally, some of the securities in our total
municipal bond portfolio are guaranteed against loss by bond
insurers. These guaranteed bonds are substantially all
investment grade and were generally underwritten in accordance
with our own investment standards prior to the determination to
purchase, without relying on the bond insurer’s guarantee in
making the investment decision. The credit quality of our
municipal bond holdings are monitored as part of our ongoing
impairment analysis.
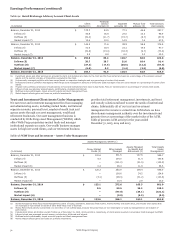
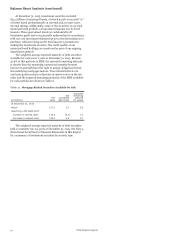
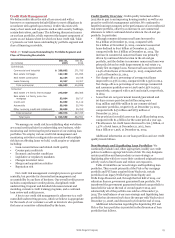
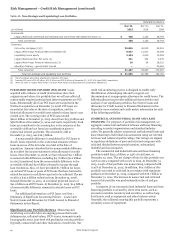
The weighted-average expected maturity of debt securities
available-for-sale was 6.1 years at December 31, 2015. Because
47.9% of this portfolio is MBS, the expected remaining maturity
is shorter than the remaining contractual maturity because
borrowers generally have the right to prepay obligations before
the underlying mortgages mature. The estimated effects of a
200 basis point increase or decrease in interest rates on the fair
value and the expected remaining maturity of the MBS available-
for-sale portfolio are shown in Table 11.
Table 11: Mortgage-Backed Securities Available for Sale
Expected
Net remaining
Fair unrealized maturity
(in billions) value gain (loss) (in years)
At December 31, 2015
Actual 127.2 2.0 5.6
Assuming a 200 basis point:
Increase in interest rates 115.5 (9.7) 7.1
Decrease in interest rates 132.0 6.8 2.7
The weighted-average expected maturity of debt securities
held-to-maturity was 6.5 years at December 31, 2015. See Note 5
(Investment Securities) to Financial Statements in this Report
for a summary of investment securities by security type.
Wells Fargo & Company
54