Wells Fargo 2015 Annual Report Download - page 42
Download and view the complete annual report
Please find page 42 of the 2015 Wells Fargo annual report below. You can navigate through the pages in the report by either clicking on the pages listed below, or by using the keyword search tool below to find specific information within the annual report.-
 1
1 -
2
-
3
-
4
-
5
-
6
-
7
-
8
-
9
-
10
-
11
-
12
-
13
-
14
-
15
-
16
-
17
-
18
-
19
-
20
-
21
-
22
-
23
-
24
-
25
-
26
-
27
-
28
-
29
-
30
-
31
-
 32
32 -
 33
33 -
 34
34 -
 35
35 -
 36
36 -
 37
37 -
 38
38 -
 39
39 -
 40
40 -
 41
41 -
 42
42 -
 43
43 -
 44
44 -
 45
45 -
 46
46 -
 47
47 -
 48
48 -
 49
49 -
 50
50 -
 51
51 -
 52
52 -
53
-
54
-
55
-
56
-
57
-
58
-
59
-
60
-
61
-
62
-
63
-
64
-
65
-
66
-
67
-
68
-
69
-
70
-
71
-
72
-
73
-
74
-
75
-
76
-
77
-
78
-
79
-
80
-
81
-
82
-
83
-
84
-
85
-
86
-
87
-
88
-
89
-
90
-
91
-
92
-
93
-
94
-
95
-
96
-
97
-
98
-
99
-
100
-
101
-
102
-
103
-
104
-
105
-
106
-
107
-
108
-
109
-
110
-
111
-
112
-
113
-
114
-
115
-
116
-
117
-
118
-
119
-
120
-
121
-
122
-
123
-
124
-
125
-
126
-
127
-
128
-
129
-
130
-
131
-
132
-
133
-
134
-
135
-
136
-
137
-
138
-
139
-
140
-
141
-
142
-
143
-
144
-
145
-
146
-
147
-
148
-
149
-
150
-
151
-
152
-
153
-
154
-
155
-
156
-
157
-
158
-
159
-
160
-
161
-
162
-
163
-
164
-
165
-
166
-
167
-
168
-
169
-
170
-
171
-
172
-
173
-
174
-
175
-
176
-
177
-
178
-
179
-
180
-
181
-
182
-
183
-
184
-
185
-
186
-
187
-
188
-
189
-
190
-
191
-
192
-
193
-
194
-
195
-
196
-
197
-
198
-
199
-
200
-
201
-
202
-
203
-
204
-
205
-
206
-
207
-
208
-
209
-
210
-
211
-
212
-
213
-
214
-
215
-
216
-
217
-
218
-
219
-
220
-
221
-
222
-
223
-
224
-
225
-
226
-
227
-
228
-
229
-
230
-
231
-
232
-
233
-
234
-
235
-
236
-
237
-
238
-
239
-
240
-
241
-
242
-
243
-
244
-
245
-
246
-
247
-
248
-
249
-
250
-
251
-
252
-
253
-
254
-
255
-
256
-
257
-
258
-
259
-
260
-
261
-
262
-
263
-
264
-
265
-
266
-
267
-
268
-
269
-
270
-
271
-
272
-
273
 |
 |

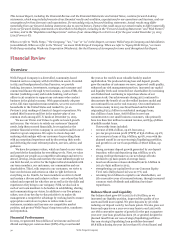
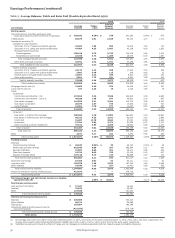
Earnings Performance (continued)
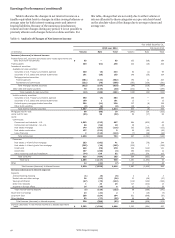
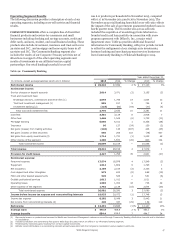
Table 6 allocates the changes in net interest income on a this table, changes that are not solely due to either volume or
taxable-equivalent basis to changes in either average balances or rate are allocated to these categories on a pro-rata basis based
average rates for both interest-earning assets and interest- on the absolute value of the change due to average volume and
bearing liabilities. Because of the numerous simultaneous average rate.
volume and rate changes during any period, it is not possible to
precisely allocate such changes between volume and rate. For
Table 6: Analysis of Changes of Net Interest Income
Year ended December 31,
2015 over 2014 2014 over 2013
(in millions) Volume Rate Total Volume Rate Total
Increase (decrease) in interest income:
Federal funds sold, securities purchased under resale agreements and
other short-term investments $ 65 — 65 252 (68) 184
Trading assets 349 (51) 298 324 (18) 306
Investment securities:
Available-for-sale securities:
Securities of U.S. Treasury and federal agencies 340 (6) 334 60 (1) 59
Securities of U.S. states and political subdivisions 181 (26) 155 140 (36) 104
Mortgage-backed securities:
Federal agencies (381) (121) (502) 193 11 204
Residential and commercial (232) (76) (308) (262) (129) (391)
Total mortgage-backed securities (613) (197) (810) (69) (118) (187)
Other debt and equity securities 79 (119) (40) (270) 71 (199)
Total available-for-sale securities (13) (348) (361) (139) (84) (223)
Held-to-maturity securities:
Securities of U.S. Treasury and federal agencies 590 (7) 583 385 — 385
Securities of U.S. states and political subdivisions 100 1 101 12 — 12
Federal agency mortgage-backed securities 359 (21) 338 137 (8) 129
Other debt securities (2) (6) (8) 109 — 109
Total held-to-maturity securities 1,047 (33) 1,014 643 (8) 635
Mortgages held for sale 98 (80) 18 (643) 120 (523)
Loans held for sale (95) 36 (59) 82 (17) 65
Loans:
Commercial:
Commercial and industrial - U.S. 1,092 (125) 967 664 (602) 62
Commercial and industrial - non U.S. 66 (56) 10 35 — 35
Real estate mortgage 149 (265) (116) 203 (336) (133)
Real estate construction 127 (122) 5 52 (95) (43)
Lease financing 2 (115) (113) (7) (58) (65)
Total commercial 1,436 (683) 753 947 (1,091) (144)
Consumer:
Real estate 1-4 family first mortgage 283 (242) 41 320 (76) 244
Real estate 1-4 family junior lien mortgage (265) (30) (295) (335) 7 (328)
Credit card 448 (78) 370 332 (122) 210
Automobile 237 (240) (3) 354 (342) 12
Other revolving credit and installment (74) 156 82 (167) 270 103
Total consumer 629 (434) 195 504 (263) 241
Total loans 2,065 (1,117) 948 1,451 (1,354) 97
Other
Total increase (decrease) in interest income
14
3,530
(21)
(1,614)
(7)
1,916
17
1,987
7
(1,422)
24
565
Increase (decrease) in interest expense:
Deposits:
Interest-bearing checking (1) (5) (6) 2 2 4
Market rate and other savings 26 (62) (36) 21 (68) (47)
Savings certificates (47) (75) (122) (114) (122) (236)
Other time deposits 1 24 25 117 (104) 13
Deposits in foreign offices 16 (10) 6 32 (7) 25
Total interest-bearing deposits (5) (128) (133) 58 (299) (241)
Short-term borrowings 23 (21) 2 7 (16) (9)
Long-term debt 258 (154) 104 551 (648) (97)
Other liabilities 52 (77) (25) 50 25 75
Total increase (decrease) in interest expense 328 (380) (52) 666 (938) (272)
Increase (decrease) in net interest income on a taxable-equivalent
basis $ 3,202 (1,234) 1,968 1,321 (484) 837
Wells Fargo & Company
40