Wells Fargo 2015 Annual Report Download - page 71
Download and view the complete annual report
Please find page 71 of the 2015 Wells Fargo annual report below. You can navigate through the pages in the report by either clicking on the pages listed below, or by using the keyword search tool below to find specific information within the annual report.-
 1
1 -
2
-
3
-
4
-
5
-
6
-
7
-
8
-
9
-
10
-
11
-
12
-
13
-
14
-
15
-
16
-
17
-
18
-
19
-
20
-
21
-
22
-
23
-
24
-
25
-
26
-
27
-
28
-
29
-
30
-
31
-
32
-
33
-
34
-
35
-
36
-
37
-
38
-
39
-
40
-
41
-
42
-
43
-
44
-
45
-
46
-
47
-
48
-
49
-
50
-
51
-
52
-
53
-
54
-
55
-
56
-
57
-
58
-
59
-
60
-
 61
61 -
 62
62 -
 63
63 -
 64
64 -
 65
65 -
 66
66 -
 67
67 -
 68
68 -
 69
69 -
 70
70 -
 71
71 -
 72
72 -
 73
73 -
 74
74 -
 75
75 -
 76
76 -
 77
77 -
 78
78 -
 79
79 -
 80
80 -
 81
81 -
82
-
83
-
84
-
85
-
86
-
87
-
88
-
89
-
90
-
91
-
92
-
93
-
94
-
95
-
96
-
97
-
98
-
99
-
100
-
101
-
102
-
103
-
104
-
105
-
106
-
107
-
108
-
109
-
110
-
111
-
112
-
113
-
114
-
115
-
116
-
117
-
118
-
119
-
120
-
121
-
122
-
123
-
124
-
125
-
126
-
127
-
128
-
129
-
130
-
131
-
132
-
133
-
134
-
135
-
136
-
137
-
138
-
139
-
140
-
141
-
142
-
143
-
144
-
145
-
146
-
147
-
148
-
149
-
150
-
151
-
152
-
153
-
154
-
155
-
156
-
157
-
158
-
159
-
160
-
161
-
162
-
163
-
164
-
165
-
166
-
167
-
168
-
169
-
170
-
171
-
172
-
173
-
174
-
175
-
176
-
177
-
178
-
179
-
180
-
181
-
182
-
183
-
184
-
185
-
186
-
187
-
188
-
189
-
190
-
191
-
192
-
193
-
194
-
195
-
196
-
197
-
198
-
199
-
200
-
201
-
202
-
203
-
204
-
205
-
206
-
207
-
208
-
209
-
210
-
211
-
212
-
213
-
214
-
215
-
216
-
217
-
218
-
219
-
220
-
221
-
222
-
223
-
224
-
225
-
226
-
227
-
228
-
229
-
230
-
231
-
232
-
233
-
234
-
235
-
236
-
237
-
238
-
239
-
240
-
241
-
242
-
243
-
244
-
245
-
246
-
247
-
248
-
249
-
250
-
251
-
252
-
253
-
254
-
255
-
256
-
257
-
258
-
259
-
260
-
261
-
262
-
263
-
264
-
265
-
266
-
267
-
268
-
269
-
270
-
271
-
272
-
273
 |
 |

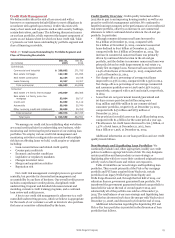
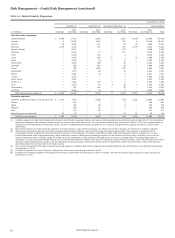
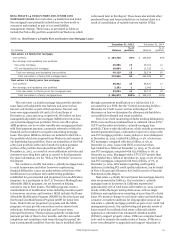
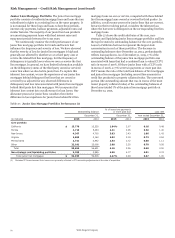
REAL ESTATE 1-4 FAMILY FIRST AND JUNIOR LIEN is discussed later in this Report. These loans also include other
MORTGAGE LOANS Our real estate 1-4 family first and junior purchased loans and loans included on our balance sheet as a
lien mortgage loans primarily include loans we have made to result of consolidation of variable interest entities (VIEs).
customers and retained as part of our asset/liability
management strategy. These loans, as presented in Table 22,
include the Pick-a-Pay portfolio acquired from Wachovia, which
Table 22: Real Estate 1-4 Family First and Junior Lien Mortgage Loans
December 31, 2015 December 31, 2014
(in millions) Balance
% of
portfolio Balance
% of
portfolio
Real estate 1-4 family first mortgage
Core portfolio
Non-strategic and liquidating loan portfolios:
Pick-a-Pay mortgage
PCI and liquidating first mortgage
$ 224,750
39,065
10,054
69%
12
3
$ 208,852
45,002
11,532
64%
14
4
Total non-strategic and liquidating loan portfolios 49,119 15 56,534 18
Total real estate 1-4 family first mortgage loans 273,869 84 265,386 82
Real estate 1-4 family junior lien mortgage
Core portfolio
Non-strategic and liquidating loan portfolios
50,652
2,352
15
1
56,631
3,086
17
1
Total real estate 1-4 family junior lien mortgage loans 53,004 16 59,717 18
Total real estate 1-4 family mortgage loans $ 326,873 100% $ 325,103 100%
The real estate 1-4 family mortgage loan portfolio includes
some loans with adjustable-rate features and some with an
interest-only feature as part of the loan terms. Interest-only
loans were approximately 9% and 12% of total loans at
December 31, 2015 and 2014, respectively. We believe we have
manageable adjustable-rate mortgage (ARM) reset risk across
our owned mortgage loan portfolios. We do not offer option
ARM products, nor do we offer variable-rate mortgage products
with fixed payment amounts, commonly referred to within the
financial services industry as negative amortizing mortgage
loans. The option ARMs we do have are included in the Pick-a-
Pay portfolio which was acquired from Wachovia and are part of
our liquidating loan portfolios. Since our acquisition of the Pick-
a-Pay loan portfolio at the end of 2008, the option payment
portion of the portfolio has reduced from 86% to 38% at
December 31, 2015, as a result of our modification activities and
customers exercising their option to convert to fixed payments.
For more information, see the “Pick-a-Pay Portfolio” section in
this Report.
We continue to modify real estate 1-4 family mortgage loans
to assist homeowners and other borrowers experiencing
financial difficulties. Loans are underwritten at the time of the
modification in accordance with underwriting guidelines
established for governmental and proprietary loan modification
programs. As a participant in the U.S. Treasury’s Making Home
Affordable (MHA) programs, we are focused on helping
customers stay in their homes. The MHA programs create a
standardization of modification terms including incentives paid
to borrowers, servicers, and investors. MHA includes the Home
Affordable Modification Program (HAMP) for first lien loans and
the Second Lien Modification Program (2MP) for junior lien
loans. Under both our proprietary programs and the MHA
programs, we may provide concessions such as interest rate
reductions, forbearance of principal, and in some cases,
principal forgiveness. These programs generally include trial
payment periods of three to four months, and after successful
completion and compliance with terms during this period, the
loan is permanently modified. Once the loan is modified either
through a permanent modification or a trial period, it is
accounted for as a TDR. See the “Critical Accounting Policies –
Allowance for Credit Losses” section in this Report for
discussion on how we determine the allowance attributable to
our modified residential real estate portfolios.
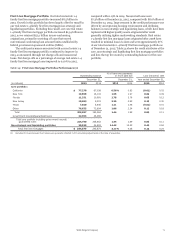
Part of our credit monitoring includes tracking delinquency,
FICO scores and loan/combined loan to collateral values (LTV/
CLTV) on the entire real estate 1-4 family mortgage loan
portfolio. These credit risk indicators, which exclude government
insured/guaranteed loans, continued to improve in 2015 on the
non-PCI mortgage portfolio. Loans 30 days or more delinquent
at December 31, 2015, totaled $8.3 billion, or 3%, of total non-
PCI mortgages, compared with $10.2 billion, or 3%, at
December 31, 2014. Loans with FICO scores lower than
640 totaled $21.1 billion at December 31, 2015, or 7% of total
non-PCI mortgages, compared with $25.8 billion, or 9%, at
December 31, 2014. Mortgages with a LTV/CLTV greater than
100% totaled $15.1 billion at December 31, 2015, or 5% of total
non-PCI mortgages, compared with $20.3 billion, or 7%, at
December 31, 2014. Information regarding credit quality
indicators, including PCI credit quality indicators, can be found
in Note 6 (Loans and Allowance for Credit Losses) to Financial
Statements in this Report.
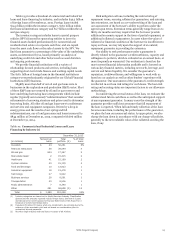
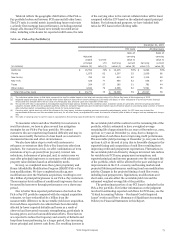
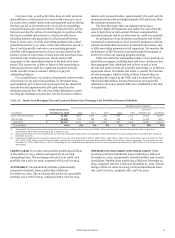
Real estate 1-4 family first and junior lien mortgage loans by
state are presented in Table 23. Our real estate 1-4 family
mortgage loans to borrowers in California represented
approximately 13% of total loans at December 31, 2015, located
mostly within the larger metropolitan areas, with no single
California metropolitan area consisting of more than 5% of total
loans. We monitor changes in real estate values and underlying
economic or market conditions for all geographic areas of our
real estate 1-4 family mortgage portfolio as part of our credit risk
management process. Our underwriting and periodic review of
loans secured by residential real estate collateral includes
appraisals or estimates from automated valuation models
(AVMs) to support property values. AVMs are computer-based
tools used to estimate the market value of homes. AVMs are a
lower-cost alternative to appraisals and support valuations of
Wells Fargo & Company
69