Wells Fargo 2015 Annual Report Download - page 44
Download and view the complete annual report
Please find page 44 of the 2015 Wells Fargo annual report below. You can navigate through the pages in the report by either clicking on the pages listed below, or by using the keyword search tool below to find specific information within the annual report.-
 1
1 -
2
-
3
-
4
-
5
-
6
-
7
-
8
-
9
-
10
-
11
-
12
-
13
-
14
-
15
-
16
-
17
-
18
-
19
-
20
-
21
-
22
-
23
-
24
-
25
-
26
-
27
-
28
-
29
-
30
-
31
-
32
-
33
-
 34
34 -
 35
35 -
 36
36 -
 37
37 -
 38
38 -
 39
39 -
 40
40 -
 41
41 -
 42
42 -
 43
43 -
 44
44 -
 45
45 -
 46
46 -
 47
47 -
 48
48 -
 49
49 -
 50
50 -
 51
51 -
 52
52 -
 53
53 -
 54
54 -
55
-
56
-
57
-
58
-
59
-
60
-
61
-
62
-
63
-
64
-
65
-
66
-
67
-
68
-
69
-
70
-
71
-
72
-
73
-
74
-
75
-
76
-
77
-
78
-
79
-
80
-
81
-
82
-
83
-
84
-
85
-
86
-
87
-
88
-
89
-
90
-
91
-
92
-
93
-
94
-
95
-
96
-
97
-
98
-
99
-
100
-
101
-
102
-
103
-
104
-
105
-
106
-
107
-
108
-
109
-
110
-
111
-
112
-
113
-
114
-
115
-
116
-
117
-
118
-
119
-
120
-
121
-
122
-
123
-
124
-
125
-
126
-
127
-
128
-
129
-
130
-
131
-
132
-
133
-
134
-
135
-
136
-
137
-
138
-
139
-
140
-
141
-
142
-
143
-
144
-
145
-
146
-
147
-
148
-
149
-
150
-
151
-
152
-
153
-
154
-
155
-
156
-
157
-
158
-
159
-
160
-
161
-
162
-
163
-
164
-
165
-
166
-
167
-
168
-
169
-
170
-
171
-
172
-
173
-
174
-
175
-
176
-
177
-
178
-
179
-
180
-
181
-
182
-
183
-
184
-
185
-
186
-
187
-
188
-
189
-
190
-
191
-
192
-
193
-
194
-
195
-
196
-
197
-
198
-
199
-
200
-
201
-
202
-
203
-
204
-
205
-
206
-
207
-
208
-
209
-
210
-
211
-
212
-
213
-
214
-
215
-
216
-
217
-
218
-
219
-
220
-
221
-
222
-
223
-
224
-
225
-
226
-
227
-
228
-
229
-
230
-
231
-
232
-
233
-
234
-
235
-
236
-
237
-
238
-
239
-
240
-
241
-
242
-
243
-
244
-
245
-
246
-
247
-
248
-
249
-
250
-
251
-
252
-
253
-
254
-
255
-
256
-
257
-
258
-
259
-
260
-
261
-
262
-
263
-
264
-
265
-
266
-
267
-
268
-
269
-
270
-
271
-
272
-
273
 |
 |

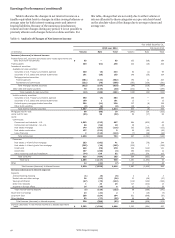
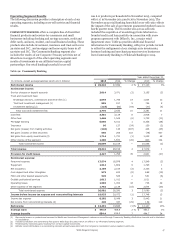
Earnings Performance (continued)
share of that income now being reported in all other income.
Other fees in 2014 were unchanged compared with 2013 as a
decline in charges and fees on loans was offset by an increase in
commercial real estate brokerage commissions. Commercial real
estate brokerage commissions increased to $618 million in 2015
compared with $469 million in 2014 and $338 million in 2013,
driven by increased sales and other property-related activities
including financing and advisory services.
Mortgage banking income, consisting of net servicing
income and net gains on loan origination/sales activities, totaled
$6.5 billion in 2015, compared with $6.4 billion in 2014 and
$8.8 billion in 2013.
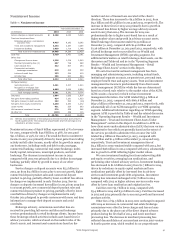
In addition to servicing fees, net mortgage loan servicing
income includes amortization of commercial mortgage servicing
rights (MSRs), changes in the fair value of residential MSRs
during the period, as well as changes in the value of derivatives
(economic hedges) used to hedge the residential MSRs. Net
servicing income of $2.4 billion for 2015 included a $885 million
net MSR valuation gain ($214 million increase in the fair value
of the MSRs and a $671 million hedge gain). Net servicing
income of $3.3 billion for 2014 included a $1.4 billion net MSR
valuation gain ($2.1 billion decrease in the fair value of the MSRs
offset by a $3.5 billion hedge gain), and net servicing income of
$1.9 billion for 2013 included a $489 million net MSR valuation
gain ($3.4 billion increase in the fair value of MSRs offset by a
$2.9 billion hedge loss). The decrease in net MSR valuation
gains in 2015, compared with 2014, was primarily attributable to
lower hedge gains. The lower net MSR valuation gain in 2013,
compared with 2014, was attributable to MSR valuation
adjustments associated with higher prepayments and increases
in servicing and foreclosure costs.
Our portfolio of loans serviced for others was $1.78 trillion
at December 31, 2015, $1.86 trillion at December 31, 2014, and
$1.90 trillion at December 31, 2013. At December 31, 2015, the
ratio of MSRs to related loans serviced for others was 0.77%,
compared with 0.75% at December 31, 2014 and 0.88% at
December 31, 2013. See the “Risk Management – Asset/Liability
Management – Mortgage Banking Interest Rate and Market
Risk” section in this Report for additional information regarding
our MSRs risks and hedging approach.
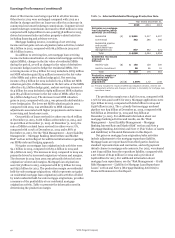
Net gains on mortgage loan origination/sale activities were
$4.1 billion in 2015, compared with $3.0 billion in 2014 and
$6.9 billion in 2013. The increase in 2015 compared to 2014 was
primarily driven by increased origination volumes and margins.
The decrease in 2014 from 2013 was primarily driven by lower
origination volume and margins. Mortgage loan originations
were $213 billion in 2015, compared with $175 billion for 2014
and $351 billion for 2013. The production margin on residential
held-for-sale mortgage originations, which represents net gains
on residential mortgage loan origination/sales activities divided
by total residential held-for-sale mortgage originations, provides
a measure of the profitability of our residential mortgage
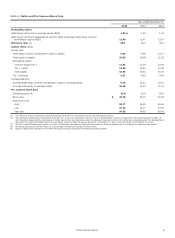
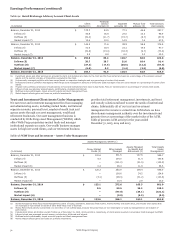
origination activity. Table 7a presents the information used in
determining the production margin.
Table 7a: Selected Residential Mortgage Production Data
Year ended December 31,
2015 2014 2013
Net gains on mortgage
loan origination/sales
activities (in millions):
Residential (A) $ 2,861 2,217 6,227
Commercial 362 285 356
Residential pipeline
and unsold/
repurchased loan
management (1) 837 542 271
Total $ 4,060 3,044 6,854
Residential real estate
originations (in
billions):
Held-for-sale
Held-for-investment
(B) $ 155
58
129
46
300
51
Total $ 213 175 351
Production margin on
residential held-for-
sale mortgage
originations (A)/(B) 1.84% 1.72 2.08
(1) Primarily includes the results of GNMA loss mitigation activities, interest rate
management activities and changes in estimate to the liability for mortgage loan
repurchase losses.
The production margin was 1.84% for 2015, compared with
1.72% for 2014 and 2.08% for 2013. Mortgage applications were
$311 billion in 2015, compared with $262 billion in 2014 and
$438 billion in 2013. The 1-4 family first mortgage unclosed
pipeline was $29 billion at December 31, 2015, compared with
$26 billion at December 31, 2014 and $25 billion at
December 31, 2013. For additional information about our
mortgage banking activities and results, see the “Risk
Management – Asset/Liability Management – Mortgage
Banking Interest Rate and Market Risk” section and Note 9
(Mortgage Banking Activities) and Note 17 (Fair Values of Assets
and Liabilities) to Financial Statements in this Report.
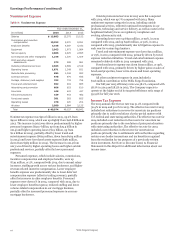
Net gains on mortgage loan origination/sales activities
include adjustments to the mortgage repurchase liability.
Mortgage loans are repurchased from third parties based on
standard representations and warranties, and early payment
default clauses in mortgage sale contracts. For 2015, we released
a net $159 million from the repurchase liability, compared with
a net release of $140 million for 2014 and a provision of
$428 million for 2013. For additional information about
mortgage loan repurchases, see the “Risk Management – Credit
Risk Management – Liability for Mortgage Loan Repurchase
Losses” section and Note 9 (Mortgage Banking Activities) to
Financial Statements in this Report.
Wells Fargo & Company
42