Wells Fargo 2015 Annual Report Download - page 148
Download and view the complete annual report
Please find page 148 of the 2015 Wells Fargo annual report below. You can navigate through the pages in the report by either clicking on the pages listed below, or by using the keyword search tool below to find specific information within the annual report.-
 1
1 -
2
-
3
-
4
-
5
-
6
-
7
-
8
-
9
-
10
-
11
-
12
-
13
-
14
-
15
-
16
-
17
-
18
-
19
-
20
-
21
-
22
-
23
-
24
-
25
-
26
-
27
-
28
-
29
-
30
-
31
-
32
-
33
-
34
-
35
-
36
-
37
-
38
-
39
-
40
-
41
-
42
-
43
-
44
-
45
-
46
-
47
-
48
-
49
-
50
-
51
-
52
-
53
-
54
-
55
-
56
-
57
-
58
-
59
-
60
-
61
-
62
-
63
-
64
-
65
-
66
-
67
-
68
-
69
-
70
-
71
-
72
-
73
-
74
-
75
-
76
-
77
-
78
-
79
-
80
-
81
-
82
-
83
-
84
-
85
-
86
-
87
-
88
-
89
-
90
-
91
-
92
-
93
-
94
-
95
-
96
-
97
-
98
-
99
-
100
-
101
-
102
-
103
-
104
-
105
-
106
-
107
-
108
-
109
-
110
-
111
-
112
-
113
-
114
-
115
-
116
-
117
-
118
-
119
-
120
-
121
-
122
-
123
-
124
-
125
-
126
-
127
-
128
-
129
-
130
-
131
-
132
-
133
-
134
-
135
-
136
-
137
-
 138
138 -
 139
139 -
 140
140 -
 141
141 -
 142
142 -
 143
143 -
 144
144 -
 145
145 -
 146
146 -
 147
147 -
 148
148 -
 149
149 -
 150
150 -
 151
151 -
 152
152 -
 153
153 -
 154
154 -
 155
155 -
 156
156 -
 157
157 -
 158
158 -
159
-
160
-
161
-
162
-
163
-
164
-
165
-
166
-
167
-
168
-
169
-
170
-
171
-
172
-
173
-
174
-
175
-
176
-
177
-
178
-
179
-
180
-
181
-
182
-
183
-
184
-
185
-
186
-
187
-
188
-
189
-
190
-
191
-
192
-
193
-
194
-
195
-
196
-
197
-
198
-
199
-
200
-
201
-
202
-
203
-
204
-
205
-
206
-
207
-
208
-
209
-
210
-
211
-
212
-
213
-
214
-
215
-
216
-
217
-
218
-
219
-
220
-
221
-
222
-
223
-
224
-
225
-
226
-
227
-
228
-
229
-
230
-
231
-
232
-
233
-
234
-
235
-
236
-
237
-
238
-
239
-
240
-
241
-
242
-
243
-
244
-
245
-
246
-
247
-
248
-
249
-
250
-
251
-
252
-
253
-
254
-
255
-
256
-
257
-
258
-
259
-
260
-
261
-
262
-
263
-
264
-
265
-
266
-
267
-
268
-
269
-
270
-
271
-
272
-
273
 |
 |
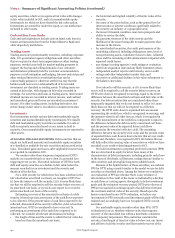
Note 1: Summary of Significant Accounting Policies (continued)
any underlying collateral. Probability of default and severity at
the time of default are statistically derived through historical
observations of default and losses after default within each credit
risk rating. These estimates are adjusted as appropriate based on
additional analysis of long-term average loss experience
compared to previously forecasted losses, external loss data or
other risks identified from current economic conditions and
credit quality trends. The estimated probability of default and
severity at the time of default are applied to loan equivalent
exposures to estimate losses for unfunded credit commitments.
The allowance also includes an amount for the estimated
impairment on nonaccrual commercial loans and commercial
loans modified in a TDR, whether on accrual or nonaccrual
status.
CONSUMER PORTFOLIO SEGMENT ACL METHODOLOGY
For consumer loans that are not identified as a TDR, we
determine the allowance predominantly on a collective basis
utilizing forecasted losses to represent our best estimate of
inherent loss. We pool loans, generally by product types with
similar risk characteristics, such as residential real estate
mortgages and credit cards. As appropriate and to achieve
greater accuracy, we may further stratify selected portfolios by
sub-product, origination channel, vintage, loss type, geographic
location and other predictive characteristics. Models designed
for each pool are utilized to develop the loss estimates. We use
assumptions for these pools in our forecast models, such as
historic delinquency and default, loss severity, home price
trends, unemployment trends, and other key economic variables
that may influence the frequency and severity of losses in the
pool.
In determining the appropriate allowance attributable to
our residential mortgage portfolio, we take into consideration
portfolios determined to be at elevated risk, such as junior lien
mortgages behind delinquent first lien mortgages and junior
lien lines of credit subject to near term significant payment
increases. We incorporate the default rates and high severity of
loss for these higher risk portfolios, including the impact of our
established loan modification programs. Accordingly, the loss
content associated with the effects of loan modifications and
higher risk portfolios has been captured in our allowance
methodology.
We separately estimate impairment for consumer loans that
have been modified in a TDR (including trial modifications),
whether on accrual or nonaccrual status.
OTHER ACL MATTERS The allowance for credit losses for both
portfolio segments includes an amount for imprecision or
uncertainty that may change from period to period. This amount
represents management’s judgment of risks inherent in the
processes and assumptions used in establishing the allowance.
This imprecision considers economic environmental factors,
modeling assumptions and performance, process risk, and other
subjective factors, including industry trends and emerging risk
assessments.
Securitizations and Beneficial Interests
In certain asset securitization transactions that meet the
applicable criteria to be accounted for as a sale, assets are sold to
an entity referred to as a Special Purpose Entity (SPE), which
then issues beneficial interests in the form of senior and
subordinated interests collateralized by the assets. In some
cases, we may retain beneficial interests issued by the entity.
Additionally, from time to time, we may also re-securitize certain
assets in a new securitization transaction.
The assets and liabilities transferred to an SPE are excluded
from our consolidated balance sheet if the transfer qualifies as a
sale and we are not required to consolidate the SPE.
For transfers of financial assets recorded as sales, we
recognize and initially measure at fair value all assets obtained
(including beneficial interests) and liabilities incurred. We
record a gain or loss in noninterest income for the difference
between the carrying amount and the fair value of the assets
sold. Fair values are based on quoted market prices, quoted
market prices for similar assets, or if market prices are not
available, then the fair value is estimated using discounted cash
flow analyses with assumptions for credit losses, prepayments
and discount rates that are corroborated by and verified against
market observable data, where possible. Retained interests and
liabilities incurred from securitizations with off-balance sheet
entities, including SPEs and VIEs, where we are not the primary
beneficiary, are classified as investment securities, trading
account assets, loans, MSRs or other liabilities (including
liabilities for mortgage repurchase losses) and are accounted for
as described herein.
Mortgage Servicing Rights (MSRs)
We recognize the rights to service mortgage loans for others, or
MSRs, as assets whether we purchase the MSRs or the MSRs
result from a sale or securitization of loans we originate (asset
transfers). We initially record all of our MSRs at fair value.
Subsequently, residential loan MSRs are carried at fair value. All
of our MSRs related to our commercial mortgage loans are
subsequently measured at LOCOM. The valuation and sensitivity
of MSRs is discussed further in Note 8 (Securitizations and
Variable Interest Entities), Note 9 (Mortgage Banking Activities)
and Note 17 (Fair Values of Assets and Liabilities).
For MSRs carried at fair value, changes in fair value are
reported in noninterest income in the period in which the
change occurs. MSRs subsequently measured at LOCOM are
amortized in proportion to, and over the period of, estimated net
servicing income. The amortization of MSRs is reported in
noninterest income, analyzed monthly and adjusted to reflect
changes in prepayment speeds, as well as other factors.
MSRs accounted for at LOCOM are periodically evaluated
for impairment based on the fair value of those assets. For
purposes of impairment evaluation and measurement, we
stratify MSRs based on the predominant risk characteristics of
the underlying loans, including investor and product type. If, by
individual stratum, the carrying amount of these MSRs exceeds
fair value, a valuation allowance is established. The valuation
reserve is adjusted as the fair value changes.
Premises and Equipment
Premises and equipment are carried at cost less accumulated
depreciation and amortization. Capital leases, where we are the
lessee, are included in premises and equipment at the capitalized
amount less accumulated amortization.
We primarily use the straight-line method of depreciation
and amortization. Estimated useful lives range up to 40 years for
buildings, up to 10 years for furniture and equipment, and the
shorter of the estimated useful life (up to 8 years) or the lease
term for leasehold improvements. We amortize capitalized
leased assets on a straight-line basis over the lives of the
respective leases.
Goodwill and Identifiable Intangible Assets
Goodwill is recorded in business combinations under the
purchase method of accounting when the purchase price is
Wells Fargo & Company
146