Wells Fargo 2015 Annual Report Download - page 36
Download and view the complete annual report
Please find page 36 of the 2015 Wells Fargo annual report below. You can navigate through the pages in the report by either clicking on the pages listed below, or by using the keyword search tool below to find specific information within the annual report.-
 1
1 -
2
-
3
-
4
-
5
-
6
-
7
-
8
-
9
-
10
-
11
-
12
-
13
-
14
-
15
-
16
-
17
-
18
-
19
-
20
-
21
-
22
-
23
-
24
-
25
-
 26
26 -
 27
27 -
 28
28 -
 29
29 -
 30
30 -
 31
31 -
 32
32 -
 33
33 -
 34
34 -
 35
35 -
 36
36 -
 37
37 -
 38
38 -
 39
39 -
 40
40 -
 41
41 -
 42
42 -
 43
43 -
 44
44 -
 45
45 -
 46
46 -
47
-
48
-
49
-
50
-
51
-
52
-
53
-
54
-
55
-
56
-
57
-
58
-
59
-
60
-
61
-
62
-
63
-
64
-
65
-
66
-
67
-
68
-
69
-
70
-
71
-
72
-
73
-
74
-
75
-
76
-
77
-
78
-
79
-
80
-
81
-
82
-
83
-
84
-
85
-
86
-
87
-
88
-
89
-
90
-
91
-
92
-
93
-
94
-
95
-
96
-
97
-
98
-
99
-
100
-
101
-
102
-
103
-
104
-
105
-
106
-
107
-
108
-
109
-
110
-
111
-
112
-
113
-
114
-
115
-
116
-
117
-
118
-
119
-
120
-
121
-
122
-
123
-
124
-
125
-
126
-
127
-
128
-
129
-
130
-
131
-
132
-
133
-
134
-
135
-
136
-
137
-
138
-
139
-
140
-
141
-
142
-
143
-
144
-
145
-
146
-
147
-
148
-
149
-
150
-
151
-
152
-
153
-
154
-
155
-
156
-
157
-
158
-
159
-
160
-
161
-
162
-
163
-
164
-
165
-
166
-
167
-
168
-
169
-
170
-
171
-
172
-
173
-
174
-
175
-
176
-
177
-
178
-
179
-
180
-
181
-
182
-
183
-
184
-
185
-
186
-
187
-
188
-
189
-
190
-
191
-
192
-
193
-
194
-
195
-
196
-
197
-
198
-
199
-
200
-
201
-
202
-
203
-
204
-
205
-
206
-
207
-
208
-
209
-
210
-
211
-
212
-
213
-
214
-
215
-
216
-
217
-
218
-
219
-
220
-
221
-
222
-
223
-
224
-
225
-
226
-
227
-
228
-
229
-
230
-
231
-
232
-
233
-
234
-
235
-
236
-
237
-
238
-
239
-
240
-
241
-
242
-
243
-
244
-
245
-
246
-
247
-
248
-
249
-
250
-
251
-
252
-
253
-
254
-
255
-
256
-
257
-
258
-
259
-
260
-
261
-
262
-
263
-
264
-
265
-
266
-
267
-
268
-
269
-
270
-
271
-
272
-
273
 |
 |

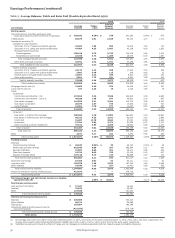
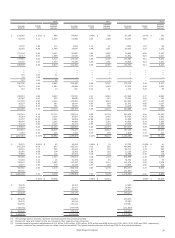
Earnings Performance
Wells Fargo net income for 2015 was $22.9 billion ($4.12 diluted
earnings per common share), compared with $23.1 billion
($4.10 diluted per share) for 2014 and $21.9 billion
($3.89 diluted per share) for 2013. Our 2015 earnings reflected
continued strong execution of our business strategy as well as
growth in many of our businesses. Our financial performance in
2015 benefited from a $1.8 billion increase in net interest
income, which was offset by a $1.0 billion increase in our
provision for credit losses and a $937 million increase in
noninterest expense.
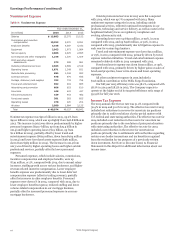
Revenue, the sum of net interest income and noninterest
income, was $86.1 billion in 2015, compared with $84.3 billion
in 2014 and $83.8 billion in 2013. The increase in revenue for
2015 compared with 2014 was predominantly due to an increase
in net interest income, reflecting increases in income from
trading assets, investment securities, and loans. Our diversified
sources of revenue generated by our businesses continued to be
balanced between net interest income and noninterest income.
In 2015, net interest income of $45.3 billion represented 53% of
revenue, compared with $43.5 billion (52%) in 2014 and
$42.8 billion (51%) in 2013.
Noninterest income was $40.8 billion in 2015, representing
47% of revenue, compared with $40.8 billion (48%) in 2014 and
$41.0 billion (49%) in 2013. Noninterest income was relatively
stable in 2015 compared with a year ago, reflecting our
continued ability to generate fee income despite fluctuations in
market sensitive revenue.
Noninterest expense was $50.0 billion in 2015, compared
with $49.0 billion in 2014 and $48.8 billion in 2013. The
increase in noninterest expense in 2015, compared with 2014,
reflected higher compensation expense and operating losses.
Noninterest expense as a percentage of revenue (efficiency ratio)
was 58.1% in 2015, 58.1% in 2014 and 58.3% in 2013, reflecting
our expense management efforts.
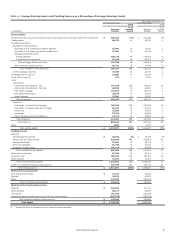
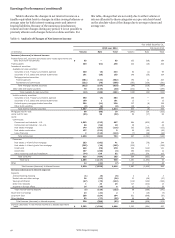
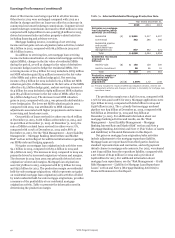
Table 3 presents the components of revenue and noninterest
expense as a percentage of revenue for year-over-year results.
Wells Fargo & Company
34