Wells Fargo 2015 Annual Report Download - page 67
Download and view the complete annual report
Please find page 67 of the 2015 Wells Fargo annual report below. You can navigate through the pages in the report by either clicking on the pages listed below, or by using the keyword search tool below to find specific information within the annual report.-
 1
1 -
2
-
3
-
4
-
5
-
6
-
7
-
8
-
9
-
10
-
11
-
12
-
13
-
14
-
15
-
16
-
17
-
18
-
19
-
20
-
21
-
22
-
23
-
24
-
25
-
26
-
27
-
28
-
29
-
30
-
31
-
32
-
33
-
34
-
35
-
36
-
37
-
38
-
39
-
40
-
41
-
42
-
43
-
44
-
45
-
46
-
47
-
48
-
49
-
50
-
51
-
52
-
53
-
54
-
55
-
56
-
 57
57 -
 58
58 -
 59
59 -
 60
60 -
 61
61 -
 62
62 -
 63
63 -
 64
64 -
 65
65 -
 66
66 -
 67
67 -
 68
68 -
 69
69 -
 70
70 -
 71
71 -
 72
72 -
 73
73 -
 74
74 -
 75
75 -
 76
76 -
 77
77 -
78
-
79
-
80
-
81
-
82
-
83
-
84
-
85
-
86
-
87
-
88
-
89
-
90
-
91
-
92
-
93
-
94
-
95
-
96
-
97
-
98
-
99
-
100
-
101
-
102
-
103
-
104
-
105
-
106
-
107
-
108
-
109
-
110
-
111
-
112
-
113
-
114
-
115
-
116
-
117
-
118
-
119
-
120
-
121
-
122
-
123
-
124
-
125
-
126
-
127
-
128
-
129
-
130
-
131
-
132
-
133
-
134
-
135
-
136
-
137
-
138
-
139
-
140
-
141
-
142
-
143
-
144
-
145
-
146
-
147
-
148
-
149
-
150
-
151
-
152
-
153
-
154
-
155
-
156
-
157
-
158
-
159
-
160
-
161
-
162
-
163
-
164
-
165
-
166
-
167
-
168
-
169
-
170
-
171
-
172
-
173
-
174
-
175
-
176
-
177
-
178
-
179
-
180
-
181
-
182
-
183
-
184
-
185
-
186
-
187
-
188
-
189
-
190
-
191
-
192
-
193
-
194
-
195
-
196
-
197
-
198
-
199
-
200
-
201
-
202
-
203
-
204
-
205
-
206
-
207
-
208
-
209
-
210
-
211
-
212
-
213
-
214
-
215
-
216
-
217
-
218
-
219
-
220
-
221
-
222
-
223
-
224
-
225
-
226
-
227
-
228
-
229
-
230
-
231
-
232
-
233
-
234
-
235
-
236
-
237
-
238
-
239
-
240
-
241
-
242
-
243
-
244
-
245
-
246
-
247
-
248
-
249
-
250
-
251
-
252
-
253
-
254
-
255
-
256
-
257
-
258
-
259
-
260
-
261
-
262
-
263
-
264
-
265
-
266
-
267
-
268
-
269
-
270
-
271
-
272
-
273
 |
 |

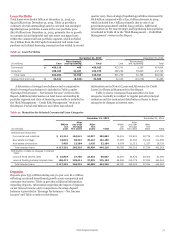
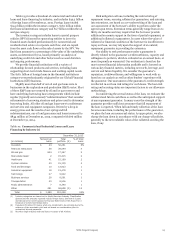
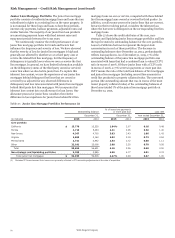
Table 19 provides a breakout of commercial and industrial
loans and lease financing by industry, and includes $49.3 billion
of foreign loans at December 31, 2015. Foreign loans totaled
$14.9 billion within the investors category, $18.1 billion within
the financial institutions category and $1.7 billion within the oil
and gas category.
The investors category includes loans to special purpose
vehicles (SPVs) formed by sponsoring entities to invest in
financial assets backed predominantly by commercial and
residential real estate or corporate cash flow, and are repaid
from the asset cash flows or the sale of assets by the SPV. We
limit loan amounts to a percentage of the value of the underlying
assets, as determined by us, based primarily on analysis of
underlying credit risk and other factors such as asset duration
and ongoing performance.
We provide financial institutions with a variety of
relationship focused products and services, including loans
supporting short-term trade finance and working capital needs.
The $18.1 billion of foreign loans in the financial institutions
category were predominantly originated by our Global Financial
Institutions (GFI) business.
Slightly more than half of our oil and gas loans were to
businesses in the exploration and production (E&P) sector. Most
of these E&P loans are secured by oil and/or gas reserves and
have underlying borrowing base arrangements which include
regular (typically semi-annual) “redeterminations” that consider
refinements to borrowing structure and prices used to determine
borrowing limits. All other oil and gas loans were to midstream
and services and equipment companies. Driven by a drop in
energy prices and the results of our spring and fall
redeterminations, our oil and gas nonaccrual loans increased to
$844 million at December 31, 2015, compared with $76 million
at December 31, 2014.
Table 19: Commercial and Industrial Loans and Lease
Financing by Industry (1)
December 31, 2015
Nonaccrual Total % of total
(in millions) loans portfolio (2) loans
Investors $ 23 52,261 6%
Financial institutions 38 39,544 4
Oil and gas 844 17,367 2
Real estate lessor 2 15,315 2
Healthcare 41 15,189 2
Cyclical retailers 20 15,135 2
Food and beverage 10 13,923 1
Industrial equipment 18 13,478 1
Technology 27 9,922 1
Business services 28 8,581 1
Transportation 40 8,506 1
Public administration 7 8,340 1
Other 291 94,698 (3) 10
Total $ 1,389 312,259 34%
(1) Industry categories are based on the North American Industry Classification
System and the amounts reported include foreign loans. See Note 6 (Loans
and Allowance for Credit Losses) to Financial Statements in this Report for a
breakout of commercial foreign loans.
(2) Includes $78 million PCI loans, which are considered to be accruing due to the
existence of the accretable yield and not based on consideration given to
contractual interest payments.
(3) No other single industry had total loans in excess of $6.4 billion.
Risk mitigation actions, including the restructuring of
repayment terms, securing collateral or guarantees, and entering
into extensions, are based on a re-underwriting of the loan and
our assessment of the borrower’s ability to perform under the
agreed-upon terms. Extension terms generally range from six to
thirty-six months and may require that the borrower provide
additional economic support in the form of partial repayment, or
additional collateral or guarantees. In cases where the value of
collateral or financial condition of the borrower is insufficient to
repay our loan, we may rely upon the support of an outside
repayment guarantee in providing the extension.
Our ability to seek performance under a guarantee is
directly related to the guarantor’s creditworthiness, capacity and
willingness to perform, which is evaluated on an annual basis, or
more frequently as warranted. Our evaluation is based on the
most current financial information available and is focused on
various key financial metrics, including net worth, leverage, and
current and future liquidity. We consider the guarantor’s
reputation, creditworthiness, and willingness to work with us
based on our analysis as well as other lenders’ experience with
the guarantor. Our assessment of the guarantor’s credit strength
is reflected in our loan risk ratings for such loans. The loan risk
rating and accruing status are important factors in our allowance
methodology.
In considering the accrual status of the loan, we evaluate the
collateral and future cash flows as well as the anticipated support
of any repayment guarantor. In many cases the strength of the
guarantor provides sufficient assurance that full repayment of
the loan is expected. When full and timely collection of the loan
becomes uncertain, including the performance of the guarantor,
we place the loan on nonaccrual status. As appropriate, we also
charge the loan down in accordance with our charge-off policies,
generally to the net realizable value of the collateral securing the
loan, if any.
Wells Fargo & Company
65