Wells Fargo 2015 Annual Report Download - page 160
Download and view the complete annual report
Please find page 160 of the 2015 Wells Fargo annual report below. You can navigate through the pages in the report by either clicking on the pages listed below, or by using the keyword search tool below to find specific information within the annual report.-
 1
1 -
2
-
3
-
4
-
5
-
6
-
7
-
8
-
9
-
10
-
11
-
12
-
13
-
14
-
15
-
16
-
17
-
18
-
19
-
20
-
21
-
22
-
23
-
24
-
25
-
26
-
27
-
28
-
29
-
30
-
31
-
32
-
33
-
34
-
35
-
36
-
37
-
38
-
39
-
40
-
41
-
42
-
43
-
44
-
45
-
46
-
47
-
48
-
49
-
50
-
51
-
52
-
53
-
54
-
55
-
56
-
57
-
58
-
59
-
60
-
61
-
62
-
63
-
64
-
65
-
66
-
67
-
68
-
69
-
70
-
71
-
72
-
73
-
74
-
75
-
76
-
77
-
78
-
79
-
80
-
81
-
82
-
83
-
84
-
85
-
86
-
87
-
88
-
89
-
90
-
91
-
92
-
93
-
94
-
95
-
96
-
97
-
98
-
99
-
100
-
101
-
102
-
103
-
104
-
105
-
106
-
107
-
108
-
109
-
110
-
111
-
112
-
113
-
114
-
115
-
116
-
117
-
118
-
119
-
120
-
121
-
122
-
123
-
124
-
125
-
126
-
127
-
128
-
129
-
130
-
131
-
132
-
133
-
134
-
135
-
136
-
137
-
138
-
139
-
140
-
141
-
142
-
143
-
144
-
145
-
146
-
147
-
148
-
149
-
 150
150 -
 151
151 -
 152
152 -
 153
153 -
 154
154 -
 155
155 -
 156
156 -
 157
157 -
 158
158 -
 159
159 -
 160
160 -
 161
161 -
 162
162 -
 163
163 -
 164
164 -
 165
165 -
 166
166 -
 167
167 -
 168
168 -
 169
169 -
 170
170 -
171
-
172
-
173
-
174
-
175
-
176
-
177
-
178
-
179
-
180
-
181
-
182
-
183
-
184
-
185
-
186
-
187
-
188
-
189
-
190
-
191
-
192
-
193
-
194
-
195
-
196
-
197
-
198
-
199
-
200
-
201
-
202
-
203
-
204
-
205
-
206
-
207
-
208
-
209
-
210
-
211
-
212
-
213
-
214
-
215
-
216
-
217
-
218
-
219
-
220
-
221
-
222
-
223
-
224
-
225
-
226
-
227
-
228
-
229
-
230
-
231
-
232
-
233
-
234
-
235
-
236
-
237
-
238
-
239
-
240
-
241
-
242
-
243
-
244
-
245
-
246
-
247
-
248
-
249
-
250
-
251
-
252
-
253
-
254
-
255
-
256
-
257
-
258
-
259
-
260
-
261
-
262
-
263
-
264
-
265
-
266
-
267
-
268
-
269
-
270
-
271
-
272
-
273
 |
 |

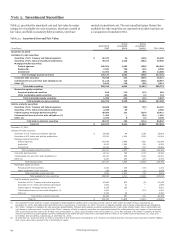
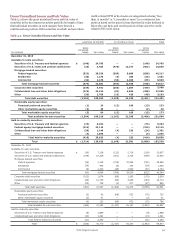
Note 5: Investment Securities (continued)
Contractual Maturities principal maturities for MBS do not consider prepayments.
Table 5.4 shows the remaining contractual maturities and Remaining expected maturities will differ from contractual
contractual weighted-average yields (taxable-equivalent basis) of maturities because borrowers may have the right to prepay
available-for-sale debt securities. The remaining contractual obligations before the underlying mortgages mature.
Table 5.4: Contractual Maturities
Remaining contractual maturity
After one year After five years
Total Within one year through five years through ten years After ten years
(in millions) amount Yield Amount Yield Amount Yield Amount Yield Amount Yield
December 31, 2015
Available-for-sale securities (1):
Securities of U.S. Treasury and federal
agencies $ 36,250 1.49% $ 216 0.77% $ 31,602 1.44% $ 4,432 1.86% $ — —%
Securities of U.S. states and political
subdivisions 49,990 5.82 1,969 2.09 7,709 2.02 3,010 5.25 37,302 6.85
Mortgage-backed securities:
Federal agencies 104,546 3.29 3 6.55 373 1.58 1,735 3.84 102,435 3.29
Residential 8,558 4.17 — — 34 5.11 34 6.03 8,490 4.16
Commercial 14,088 5.06 — — 61 2.79 — — 14,027 5.07
Total mortgage-backed securities 127,192 3.54 3 6.55 468 1.99 1,769 3.88 124,952 3.55
Corporate debt securities 15,411 4.57 1,960 3.84 6,731 4.47 5,459 4.76 1,261 5.47
Collateralized loan and other debt
obligations 30,967 2.08 2 0.33 804 0.90 12,707 2.01 17,454 2.19
Other 5,911 2.05 68 2.47 1,228 2.57 953 1.94 3,662 1.89
Total available-for-sale debt
securities at fair value $ 265,721 3.55% $ 4,218 2.84% $ 48,542 1.98% $ 28,330 2.98% $184,631 4.07%
December 31, 2014
Available-for-sale securities (1):
Securities of U.S. Treasury and federal
agencies $ 25,804 1.49 % $ 181 1.47 % $ 22,348 1.44 % $ 3,275 1.83 % $ — — %
Securities of U.S. states and political
subdivisions 44,944 5.66 3,568 1.71 7,050 2.19 3,235 5.13 31,091 6.96
Mortgage-backed securities:
Federal agencies 110,089 3.27 — — 276 2.86 1,011 3.38 108,802 3.27
Residential 9,269 4.50 — — 9 4.81 83 5.63 9,177 4.49
Commercial 16,994 5.16 1 0.28 62 2.71 5 1.30 16,926 5.17
Total mortgage-backed securities 136,352 3.59 1 0.28 347 2.88 1,099 3.54 134,905 3.59
Corporate debt securities 14,786 4.90 600 4.32 7,634 4.54 5,209 5.30 1,343 5.70
Collateralized loan and other debt obligations 25,361 1.83 23 1.95 944 0.71 8,472 1.67 15,922 1.99
Other 6,519 1.79 274 1.55 1,452 2.56 1,020 1.32 3,773 1.64
Total available-for-sale debt securities at
fair value $ 253,766 3.60 % $ 4,647 2.03 % $ 39,775 2.20 % $ 22,310 3.12 % $ 187,034 3.99 %
(1) Weighted-average yields displayed by maturity bucket are weighted based on fair value and predominantly represent contractual coupon rates without effect for any related
hedging derivatives.
Wells Fargo & Company
158