Wells Fargo 2015 Annual Report Download - page 222
Download and view the complete annual report
Please find page 222 of the 2015 Wells Fargo annual report below. You can navigate through the pages in the report by either clicking on the pages listed below, or by using the keyword search tool below to find specific information within the annual report.-
 1
1 -
2
-
3
-
4
-
5
-
6
-
7
-
8
-
9
-
10
-
11
-
12
-
13
-
14
-
15
-
16
-
17
-
18
-
19
-
20
-
21
-
22
-
23
-
24
-
25
-
26
-
27
-
28
-
29
-
30
-
31
-
32
-
33
-
34
-
35
-
36
-
37
-
38
-
39
-
40
-
41
-
42
-
43
-
44
-
45
-
46
-
47
-
48
-
49
-
50
-
51
-
52
-
53
-
54
-
55
-
56
-
57
-
58
-
59
-
60
-
61
-
62
-
63
-
64
-
65
-
66
-
67
-
68
-
69
-
70
-
71
-
72
-
73
-
74
-
75
-
76
-
77
-
78
-
79
-
80
-
81
-
82
-
83
-
84
-
85
-
86
-
87
-
88
-
89
-
90
-
91
-
92
-
93
-
94
-
95
-
96
-
97
-
98
-
99
-
100
-
101
-
102
-
103
-
104
-
105
-
106
-
107
-
108
-
109
-
110
-
111
-
112
-
113
-
114
-
115
-
116
-
117
-
118
-
119
-
120
-
121
-
122
-
123
-
124
-
125
-
126
-
127
-
128
-
129
-
130
-
131
-
132
-
133
-
134
-
135
-
136
-
137
-
138
-
139
-
140
-
141
-
142
-
143
-
144
-
145
-
146
-
147
-
148
-
149
-
150
-
151
-
152
-
153
-
154
-
155
-
156
-
157
-
158
-
159
-
160
-
161
-
162
-
163
-
164
-
165
-
166
-
167
-
168
-
169
-
170
-
171
-
172
-
173
-
174
-
175
-
176
-
177
-
178
-
179
-
180
-
181
-
182
-
183
-
184
-
185
-
186
-
187
-
188
-
189
-
190
-
191
-
192
-
193
-
194
-
195
-
196
-
197
-
198
-
199
-
200
-
201
-
202
-
203
-
204
-
205
-
206
-
207
-
208
-
209
-
210
-
211
-
 212
212 -
 213
213 -
 214
214 -
 215
215 -
 216
216 -
 217
217 -
 218
218 -
 219
219 -
 220
220 -
 221
221 -
 222
222 -
 223
223 -
 224
224 -
 225
225 -
 226
226 -
 227
227 -
 228
228 -
 229
229 -
 230
230 -
 231
231 -
 232
232 -
233
-
234
-
235
-
236
-
237
-
238
-
239
-
240
-
241
-
242
-
243
-
244
-
245
-
246
-
247
-
248
-
249
-
250
-
251
-
252
-
253
-
254
-
255
-
256
-
257
-
258
-
259
-
260
-
261
-
262
-
263
-
264
-
265
-
266
-
267
-
268
-
269
-
270
-
271
-
272
-
273
 |
 |

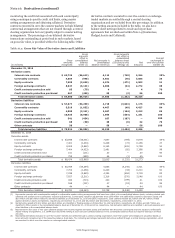
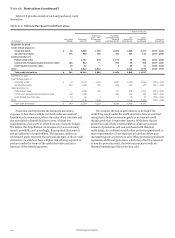
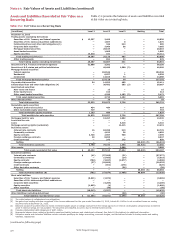
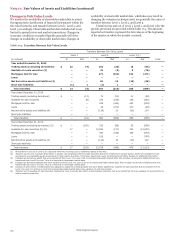
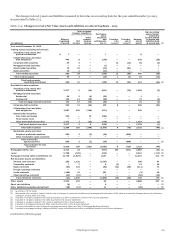
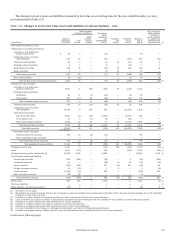
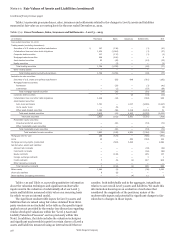
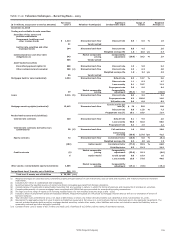
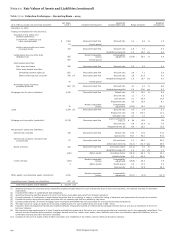
Note 17: Fair Values of Assets and Liabilities (continued)
Assets and Liabilities Recorded at Fair Value on a Table 17.2 presents the balances of assets and liabilities recorded
Recurring Basis at fair value on a recurring basis.
Table 17.2: Fair Value on a Recurring Basis
(in millions) Level 1 Level 2 Level 3 Netting Total
December 31, 2015
Trading assets (excluding derivatives)
Securities of U.S. Treasury and federal agencies $ 13,357 3,469 — — 16,826
Securities of U.S. states and political subdivisions — 1,667 8 — 1,675
Collateralized loan and other debt obligations (1) — 346 343 — 689
Corporate debt securities — 7,909 56 — 7,965
Mortgage-backed securities — 20,619 — — 20,619
Asset-backed securities — 1,005 — — 1,005
Equity securities 15,010 101 — — 15,111
Total trading securities (2) 28,367 35,116 407 — 63,890
Other trading assets — 891 34 — 925
Total trading assets (excluding derivatives) 28,367 36,007 441 — 64,815
Securities of U.S. Treasury and federal agencies 32,868 3,382 — — 36,250
Securities of U.S. states and political subdivisions — 48,490 1,500 (3) — 49,990
Mortgage-backed securities:
Federal agencies — 104,546 — — 104,546
Residential — 8,557 1 — 8,558
Commercial — 14,015 73 — 14,088
Total mortgage-backed securities — 127,118 74 — 127,192
Corporate debt securities 54 14,952 405 — 15,411
Collateralized loan and other debt obligations (4) — 30,402 565 (3) — 30,967
Asset-backed securities:
Auto loans and leases — 15 — — 15
Home equity loans — 414 — — 414
Other asset-backed securities — 4,290 1,182 (3) — 5,472
Total asset-backed securities — 4,719 1,182 — 5,901
Other debt securities — 10 — — 10
Total debt securities 32,922 229,073 3,726 — 265,721
Marketable equity securities:
Perpetual preferred securities 434 484 — — 918
Other marketable equity securities 719 — — — 719
Total marketable equity securities 1,153 484 — — 1,637
Total available-for-sale securities 34,075 229,557 3,726 — 267,358
Mortgages held for sale — 12,457 1,082 — 13,539
Loans held for sale — — — — —
Loans — — 5,316 — 5,316
Mortgage servicing rights (residential) — — 12,415 — 12,415
Derivative assets:
Interest rate contracts 16 62,390 319 — 62,725
Commodity contracts — 4,623 36 — 4,659
Equity contracts 3,726 2,907 966 — 7,599
Foreign exchange contracts 48 8,899 — — 8,947
Credit contracts — 375 275 — 650
Netting — — — (66,924) (5) (66,924)
Total derivative assets (6) 3,790 79,194 1,596 (66,924) 17,656
Other assets — — 3,088 — 3,088
Total assets recorded at fair value $ 66,232 357,215 27,664 (66,924) 384,187
Derivative liabilities:
Interest rate contracts $ (41) (57,905) (31) — (57,977)
Commodity contracts — (5,495) (24) — (5,519)
Equity contracts (704) (3,027) (1,077) — (4,808)
Foreign exchange contracts (37) (10,896) — — (10,933)
Credit contracts — (351) (278) — (629)
Other derivative contracts — — (58) — (58)
Netting — — — 66,004 (5) 66,004
Total derivative liabilities (6) (782) (77,674) (1,468) 66,004 (13,920)
Short sale liabilities:
Securities of U.S. Treasury and federal agencies (8,621) (1,074) — — (9,695)
Securities of U.S. states and political subdivisions — — — — —
Corporate debt securities — (4,209) — — (4,209)
Equity securities (1,692) (4) — — (1,696)
Other securities — (70) — — (70)
Total short sale liabilities (10,313) (5,357) — — (15,670)
Other liabilities (excluding derivatives) — — (30) — (30)
Total liabilities recorded at fair value $ (11,095) (83,031) (1,498) 66,004 (29,620)
(1) The entire balance is collateralized loan obligations.
(2) Net gains from trading activities recognized in the income statement for the year ended December 31, 2015, include $1.0 billion in net unrealized losses on trading
securities held at December 31, 2015.
(3) Balances consist of securities that are mostly investment grade based on ratings received from the ratings agencies or internal credit grades categorized as investment
grade if external ratings are not available. The securities are classified as Level 3 due to limited market activity.
(4) Includes collateralized debt obligations of $257 million.
(5) Represents balance sheet netting of derivative asset and liability balances and related cash collateral. See Note 16 (Derivatives) for additional information.
(6) Derivative assets and derivative liabilities include contracts qualifying for hedge accounting, economic hedges, and derivatives included in trading assets and trading
liabilities, respectively.
(continued on following page)
Wells Fargo & Company
220