Wells Fargo 2015 Annual Report Download - page 32
Download and view the complete annual report
Please find page 32 of the 2015 Wells Fargo annual report below. You can navigate through the pages in the report by either clicking on the pages listed below, or by using the keyword search tool below to find specific information within the annual report.-
 1
1 -
2
-
3
-
4
-
5
-
6
-
7
-
8
-
9
-
10
-
11
-
12
-
13
-
14
-
15
-
16
-
17
-
18
-
19
-
20
-
21
-
 22
22 -
 23
23 -
 24
24 -
 25
25 -
 26
26 -
 27
27 -
 28
28 -
 29
29 -
 30
30 -
 31
31 -
 32
32 -
 33
33 -
 34
34 -
 35
35 -
 36
36 -
 37
37 -
 38
38 -
 39
39 -
 40
40 -
 41
41 -
 42
42 -
43
-
44
-
45
-
46
-
47
-
48
-
49
-
50
-
51
-
52
-
53
-
54
-
55
-
56
-
57
-
58
-
59
-
60
-
61
-
62
-
63
-
64
-
65
-
66
-
67
-
68
-
69
-
70
-
71
-
72
-
73
-
74
-
75
-
76
-
77
-
78
-
79
-
80
-
81
-
82
-
83
-
84
-
85
-
86
-
87
-
88
-
89
-
90
-
91
-
92
-
93
-
94
-
95
-
96
-
97
-
98
-
99
-
100
-
101
-
102
-
103
-
104
-
105
-
106
-
107
-
108
-
109
-
110
-
111
-
112
-
113
-
114
-
115
-
116
-
117
-
118
-
119
-
120
-
121
-
122
-
123
-
124
-
125
-
126
-
127
-
128
-
129
-
130
-
131
-
132
-
133
-
134
-
135
-
136
-
137
-
138
-
139
-
140
-
141
-
142
-
143
-
144
-
145
-
146
-
147
-
148
-
149
-
150
-
151
-
152
-
153
-
154
-
155
-
156
-
157
-
158
-
159
-
160
-
161
-
162
-
163
-
164
-
165
-
166
-
167
-
168
-
169
-
170
-
171
-
172
-
173
-
174
-
175
-
176
-
177
-
178
-
179
-
180
-
181
-
182
-
183
-
184
-
185
-
186
-
187
-
188
-
189
-
190
-
191
-
192
-
193
-
194
-
195
-
196
-
197
-
198
-
199
-
200
-
201
-
202
-
203
-
204
-
205
-
206
-
207
-
208
-
209
-
210
-
211
-
212
-
213
-
214
-
215
-
216
-
217
-
218
-
219
-
220
-
221
-
222
-
223
-
224
-
225
-
226
-
227
-
228
-
229
-
230
-
231
-
232
-
233
-
234
-
235
-
236
-
237
-
238
-
239
-
240
-
241
-
242
-
243
-
244
-
245
-
246
-
247
-
248
-
249
-
250
-
251
-
252
-
253
-
254
-
255
-
256
-
257
-
258
-
259
-
260
-
261
-
262
-
263
-
264
-
265
-
266
-
267
-
268
-
269
-
270
-
271
-
272
-
273
 |
 |

This Annual Report, including the Financial Review and the Financial Statements and related Notes, contains forward-looking
statements, which may include forecasts of our financial results and condition, expectations for our operations and business, and our
assumptions for those forecasts and expectations. Do not unduly rely on forward-looking statements. Actual results may differ
materially from our forward-looking statements due to several factors. Factors that could cause our actual results to differ materially
from our forward-looking statements are described in this Report, including in the “Forward-Looking Statements” and “Risk Factors”
sections, and in the “Regulation and Supervision” section of our Annual Report on Form 10-K for the year ended December 31, 2015
(2015 Form 10-K).
When we refer to “Wells Fargo,” “the Company,” “we,” “our” or “us” in this Report, we mean Wells Fargo & Company and Subsidiaries
(consolidated). When we refer to the “Parent,” we mean Wells Fargo & Company. When we refer to “legacy Wells Fargo,” we mean
Wells Fargo excluding Wachovia Corporation (Wachovia). See the Glossary of Acronyms for terms used throughout this Report.
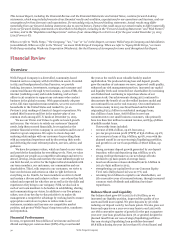
Financial Review
Overview
Wells Fargo & Company is a diversified, community-based
financial services company with $1.8 trillion in assets. Founded
in 1852 and headquartered in San Francisco, we provide
banking, insurance, investments, mortgage, and consumer and
commercial finance through 8,700 locations, 13,000 ATMs, the
internet (wellsfargo.com) and mobile banking, and we have
offices in 36 countries to support our customers who conduct
business in the global economy. With approximately 265,000
active, full-time equivalent team members, we serve one in three
households in the United States and ranked No. 30 on
Fortune’s 2015 rankings of America’s largest corporations. We
ranked third in assets and first in the market value of our
common stock among all U.S. banks at December 31, 2015.
We use our Vision and Values to guide us toward growth
and success. Our vision is to satisfy our customers’ financial
needs, help them succeed financially, be recognized as the
premier financial services company in our markets and be one of
America’s great companies. We aspire to create deep and
enduring relationships with our customers by providing them
with an exceptional experience and by discovering their needs
and delivering the most relevant products, services, advice, and
guidance.
We have five primary values, which are based on our vision
and provide the foundation for everything we do. First, we value
and support our people as a competitive advantage and strive to
attract, develop, retain and motivate the most talented people we
can find. Second, we strive for the highest ethical standards with
our team members, our customers, our communities and our
shareholders. Third, with respect to our customers, we strive to
base our decisions and actions on what is right for them in
everything we do. Fourth, for team members we strive to build
and sustain a diverse and inclusive culture – one where they feel
valued and respected for who they are as well as for the skills and
experiences they bring to our company. Fifth, we also look to
each of our team members to be leaders in establishing, sharing
and communicating our vision. In addition to our five primary
values, one of our key day-to-day priorities is to make risk
management a competitive advantage by working hard to ensure
appropriate controls are in place to reduce risks to our
customers, maintain and increase our competitive market
position, and protect Wells Fargo’s long-term safety, soundness
and reputation.
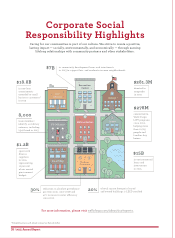
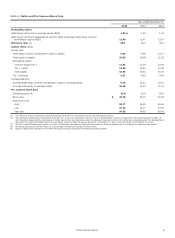
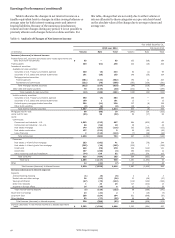
Financial Performance
In 2015, we generated $22.9 billion of net income and record
diluted earnings per common share (EPS) of $4.12 and ended
the year as the world's most valuable bank by market
capitalization. We produced strong loan and deposit growth,
grew the number of customers we serve, improved credit quality,
enhanced our risk management practices, increased our capital
and liquidity levels and rewarded our shareholders by increasing
our dividend and continuing to repurchase shares of our
common stock. Our achievements during 2015 continued to
demonstrate the benefit of our diversified business model and
our continued focus on the real economy. Our contribution to
the real economy in 2015 was broad based and included
originating $213.2 billion in residential mortgage loans,
$31.1 billion of auto loans, $18.8 billion in new loan
commitments to our small business customers, who primarily
have less than $20 million in annual revenue, and $34.4 billion
of middle market loans.
Noteworthy items included:
• revenue of $86.1 billion, up 2% from 2014;
• pre-tax pre-provision profit (PTPP) of $36.1 billion, up 2%;
• an increase in loans of $54.0 billion, up 6%, even with the
planned runoff in our non-strategic/liquidating portfolios,
and growth in our core loan portfolio of $62.8 billion, up
8%;
• strong customer deposit growth generated by our deposit
franchise, with total deposits up $55.0 billion, or 5%;
• strong credit performance as our net charge-off ratio
declined to 33 basis points of average loans;
• loan loss allowance releases declined from $1.6 billion in
2014 to $450 million in 2015;
• strengthening our capital levels as our Common Equity
Tier I ratio (fully phased-in) was 10.77%; and
• returning $12.6 billion in capital to our shareholders, our
5th consecutive year of increased returns, through increased
common stock dividends and additional net share
repurchases.
Balance Sheet and Liquidity
Our balance sheet grew 6% in 2015 to $1.8 trillion, as we
increased our liquidity position, improved the quality of our
assets and held more capital. We grew deposits by 5% while
reducing our deposit costs by two basis points. We also grew our
loans each quarter on a year-over-year basis to end 2015 with
our 18th consecutive quarter of growth (for the past 15 quarters
year-over-year loan growth has been 3% or greater) despite the
planned runoff from our non-strategic/liquidating portfolios.
Our non-strategic/liquidating loan portfolios decreased
$8.8 billion during the year (to less than 6% of total loans) and
Wells Fargo & Company
30