Wells Fargo 2015 Annual Report Download - page 101
Download and view the complete annual report
Please find page 101 of the 2015 Wells Fargo annual report below. You can navigate through the pages in the report by either clicking on the pages listed below, or by using the keyword search tool below to find specific information within the annual report.-
 1
1 -
2
-
3
-
4
-
5
-
6
-
7
-
8
-
9
-
10
-
11
-
12
-
13
-
14
-
15
-
16
-
17
-
18
-
19
-
20
-
21
-
22
-
23
-
24
-
25
-
26
-
27
-
28
-
29
-
30
-
31
-
32
-
33
-
34
-
35
-
36
-
37
-
38
-
39
-
40
-
41
-
42
-
43
-
44
-
45
-
46
-
47
-
48
-
49
-
50
-
51
-
52
-
53
-
54
-
55
-
56
-
57
-
58
-
59
-
60
-
61
-
62
-
63
-
64
-
65
-
66
-
67
-
68
-
69
-
70
-
71
-
72
-
73
-
74
-
75
-
76
-
77
-
78
-
79
-
80
-
81
-
82
-
83
-
84
-
85
-
86
-
87
-
88
-
89
-
90
-
 91
91 -
 92
92 -
 93
93 -
 94
94 -
 95
95 -
 96
96 -
 97
97 -
 98
98 -
 99
99 -
 100
100 -
 101
101 -
 102
102 -
 103
103 -
 104
104 -
 105
105 -
 106
106 -
 107
107 -
 108
108 -
 109
109 -
 110
110 -
 111
111 -
112
-
113
-
114
-
115
-
116
-
117
-
118
-
119
-
120
-
121
-
122
-
123
-
124
-
125
-
126
-
127
-
128
-
129
-
130
-
131
-
132
-
133
-
134
-
135
-
136
-
137
-
138
-
139
-
140
-
141
-
142
-
143
-
144
-
145
-
146
-
147
-
148
-
149
-
150
-
151
-
152
-
153
-
154
-
155
-
156
-
157
-
158
-
159
-
160
-
161
-
162
-
163
-
164
-
165
-
166
-
167
-
168
-
169
-
170
-
171
-
172
-
173
-
174
-
175
-
176
-
177
-
178
-
179
-
180
-
181
-
182
-
183
-
184
-
185
-
186
-
187
-
188
-
189
-
190
-
191
-
192
-
193
-
194
-
195
-
196
-
197
-
198
-
199
-
200
-
201
-
202
-
203
-
204
-
205
-
206
-
207
-
208
-
209
-
210
-
211
-
212
-
213
-
214
-
215
-
216
-
217
-
218
-
219
-
220
-
221
-
222
-
223
-
224
-
225
-
226
-
227
-
228
-
229
-
230
-
231
-
232
-
233
-
234
-
235
-
236
-
237
-
238
-
239
-
240
-
241
-
242
-
243
-
244
-
245
-
246
-
247
-
248
-
249
-
250
-
251
-
252
-
253
-
254
-
255
-
256
-
257
-
258
-
259
-
260
-
261
-
262
-
263
-
264
-
265
-
266
-
267
-
268
-
269
-
270
-
271
-
272
-
273
 |
 |

LIQUIDITY AND FUNDING The objective of effective liquidity
management is to ensure that we can meet customer loan
requests, customer deposit maturities/withdrawals and other
cash commitments efficiently under both normal operating
conditions and under periods of Wells Fargo-specific and/or
market stress. To achieve this objective, the Board of Directors
establishes liquidity guidelines that require sufficient asset-
based liquidity to cover potential funding requirements and to
avoid over-dependence on volatile, less reliable funding markets.
These guidelines are monitored on a monthly basis by the
Corporate ALCO and on a quarterly basis by the Board of
Directors. These guidelines are established and monitored for
both the consolidated company and for the Parent on a stand-
alone basis to ensure that the Parent is a source of strength for
its regulated, deposit-taking banking subsidiaries.
Liquidity Standards On September 3, 2014, the FRB, OCC
and FDIC issued a final rule that implements a quantitative
liquidity requirement consistent with the liquidity coverage ratio
(LCR) established by the Basel Committee on Banking
Supervision (BCBS). The rule requires banking institutions, such
as Wells Fargo, to hold high-quality liquid assets, such as central
bank reserves and government and corporate debt that can be
converted easily and quickly into cash, in an amount equal to or
greater than its projected net cash outflows during a 30-day
stress period. The final LCR rule began its phase-in period on
January 1, 2015, and requires full compliance with a minimum
100% LCR by January 1, 2017. The FRB also finalized rules
imposing enhanced liquidity management standards on large
bank holding companies (BHC) such as Wells Fargo. In addition,
the FRB recently proposed a rule that would require large bank
holding companies, such as Wells Fargo, to publicly disclose on a
quarterly basis certain quantitative and qualitative information
regarding their LCR calculations. We continue to analyze these
rules and other regulatory proposals that may affect liquidity
risk management to determine the level of operational or
compliance impact to Wells Fargo. For additional information
see the “Capital Management” and “Regulatory Reform” sections
in this Report.
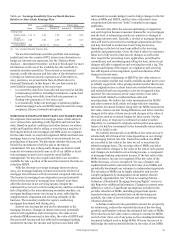
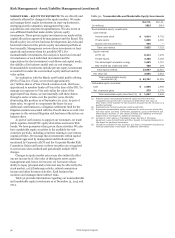
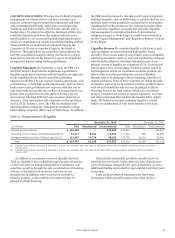
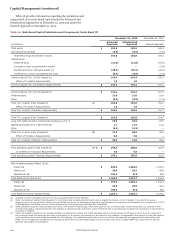
Liquidity Sources We maintain liquidity in the form of cash,
cash equivalents and unencumbered high-quality, liquid
securities. These assets make up our primary sources of liquidity
which are presented in Table 51. Our cash is primarily on deposit
with the Federal Reserve. Securities included as part of our
primary sources of liquidity are comprised of U.S. Treasury and
federal agency debt, and mortgage-backed securities issued by
federal agencies within our investment securities portfolio. We
believe these securities provide quick sources of liquidity
through sales or by pledging to obtain financing, regardless of
market conditions. Some of these securities are within the held-
to-maturity portion of our investment securities portfolio and as
such are not intended for sale but may be pledged to obtain
financing. Some of the legal entities within our consolidated
group of companies are subject to various regulatory, tax, legal
and other restrictions that can limit the transferability of their
funds. We believe we maintain adequate liquidity for these
entities in consideration of such funds transfer restrictions.
Table 51: Primary Sources of Liquidity
December 31, 2015 December 31, 2014
(in millions) Total Encumbered Unencumbered Total Encumbered Unencumbered
Interest-earning deposits $ 220,409 — 220,409 219,220 — 219,220
Securities of U.S. Treasury and federal agencies (1) 81,417 6,462 74,955 67,352 856 66,496
Mortgage-backed securities of federal agencies (2) 132,967 74,778 58,189 115,730 80,324 35,406
Total $ 434,793 81,240 353,553 402,302 81,180 321,122
(1) Included in encumbered securities at December 31, 2014, were securities with a fair value of $152 million which were purchased in December 2014, but settled in
January 2015.
(2) Included in encumbered securities at December 31, 2014, were securities with a fair value of $5 million which were purchased in December 2014, but settled in
January 2015.
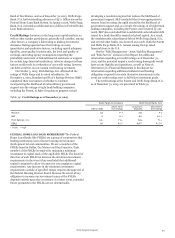
In addition to our primary sources of liquidity shown in Deposits have historically provided a sizeable source of
Table 51, liquidity is also available through the sale or financing relatively low-cost funds. At December 31, 2015, deposits were
of other securities including trading and/or available-for-sale 133% of total loans compared with 135% at December 31, 2014.
securities, as well as through the sale, securitization or financing Additional funding is provided by long-term debt and short-term
of loans, to the extent such securities and loans are not borrowings.
encumbered. In addition, other securities in our held-to- Table 52 shows selected information for short-term
maturity portfolio, to the extent not encumbered, may be borrowings, which generally mature in less than 30 days.
pledged to obtain financing.
Wells Fargo & Company
99