Wells Fargo 2015 Annual Report Download - page 81
Download and view the complete annual report
Please find page 81 of the 2015 Wells Fargo annual report below. You can navigate through the pages in the report by either clicking on the pages listed below, or by using the keyword search tool below to find specific information within the annual report.-
 1
1 -
2
-
3
-
4
-
5
-
6
-
7
-
8
-
9
-
10
-
11
-
12
-
13
-
14
-
15
-
16
-
17
-
18
-
19
-
20
-
21
-
22
-
23
-
24
-
25
-
26
-
27
-
28
-
29
-
30
-
31
-
32
-
33
-
34
-
35
-
36
-
37
-
38
-
39
-
40
-
41
-
42
-
43
-
44
-
45
-
46
-
47
-
48
-
49
-
50
-
51
-
52
-
53
-
54
-
55
-
56
-
57
-
58
-
59
-
60
-
61
-
62
-
63
-
64
-
65
-
66
-
67
-
68
-
69
-
70
-
 71
71 -
 72
72 -
 73
73 -
 74
74 -
 75
75 -
 76
76 -
 77
77 -
 78
78 -
 79
79 -
 80
80 -
 81
81 -
 82
82 -
 83
83 -
 84
84 -
 85
85 -
 86
86 -
 87
87 -
 88
88 -
 89
89 -
 90
90 -
 91
91 -
92
-
93
-
94
-
95
-
96
-
97
-
98
-
99
-
100
-
101
-
102
-
103
-
104
-
105
-
106
-
107
-
108
-
109
-
110
-
111
-
112
-
113
-
114
-
115
-
116
-
117
-
118
-
119
-
120
-
121
-
122
-
123
-
124
-
125
-
126
-
127
-
128
-
129
-
130
-
131
-
132
-
133
-
134
-
135
-
136
-
137
-
138
-
139
-
140
-
141
-
142
-
143
-
144
-
145
-
146
-
147
-
148
-
149
-
150
-
151
-
152
-
153
-
154
-
155
-
156
-
157
-
158
-
159
-
160
-
161
-
162
-
163
-
164
-
165
-
166
-
167
-
168
-
169
-
170
-
171
-
172
-
173
-
174
-
175
-
176
-
177
-
178
-
179
-
180
-
181
-
182
-
183
-
184
-
185
-
186
-
187
-
188
-
189
-
190
-
191
-
192
-
193
-
194
-
195
-
196
-
197
-
198
-
199
-
200
-
201
-
202
-
203
-
204
-
205
-
206
-
207
-
208
-
209
-
210
-
211
-
212
-
213
-
214
-
215
-
216
-
217
-
218
-
219
-
220
-
221
-
222
-
223
-
224
-
225
-
226
-
227
-
228
-
229
-
230
-
231
-
232
-
233
-
234
-
235
-
236
-
237
-
238
-
239
-
240
-
241
-
242
-
243
-
244
-
245
-
246
-
247
-
248
-
249
-
250
-
251
-
252
-
253
-
254
-
255
-
256
-
257
-
258
-
259
-
260
-
261
-
262
-
263
-
264
-
265
-
266
-
267
-
268
-
269
-
270
-
271
-
272
-
273
 |
 |

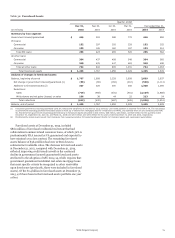
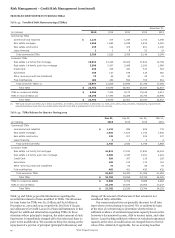
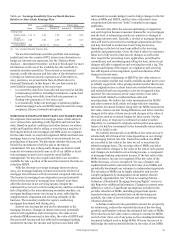
Table 32: Foreclosed Assets
Quarter ended
Dec 31, Sep 30, Jun 30, Mar 31, Year ended Dec 31,
(in millions) 2015 2015 2015 2015 2015 2014
Summary by loan segment
Government insured/guaranteed $ 446 502 588 772 446 982
PCI loans:
Commercial 152 297 305 329 152 352
Consumer 103 126 160 197 103 212
Total PCI loans 255 423 465 526 255 564
All other loans:
Commercial 384 437 458 548 384 565
Consumer 340 405 447 483 340 498
Total all other loans 724 842 905 1,031 724 1,063
Total foreclosed assets $ 1,425 1,767 1,958 2,329 1,425 2,609
Analysis of changes in foreclosed assets
Balance, beginning of period $ 1,767 1,958 2,329 2,609 2,609 3,937
Net change in government insured/guaranteed (1) (56) (86) (184) (210) (536) (1,111)
Additions to foreclosed assets (2) 327 325 300 356 1,308 1,595
Reductions:
Sales (719) (468) (531) (451) (2,169) (1,866)
Write-downs and net gains (losses) on sales 106 38 44 25 213 54
Total reductions (613) (430) (487) (426) (1,956) (1,812)
Balance, end of period $ 1,425 1,767 1,958 2,329 1,425 2,609
(1) Foreclosed government insured/guaranteed loans are temporarily transferred to and held by us as servicer, until reimbursement is received from FHA or VA. The net change
in government insured/guaranteed foreclosed assets is made up of inflows from mortgages held for investment and MHFS, and outflows when we are reimbursed by FHA/
VA. Transfers from government insured/guaranteed loans to foreclosed assets amounted to $46 million, $38 million, $24 million, and $49 million for the quarters ended
December 31, September 30, June 30, and March 31, 2015 and $157 million and $191 million for the years ended December 31, 2015 and 2014, respectively.
(2) Predominantly include loans moved into foreclosure from nonaccrual status, PCI loans transitioned directly to foreclosed assets and repossessed automobiles.
Foreclosed assets at December 31, 2015, included
$861 million of foreclosed residential real estate that had
collateralized commercial and consumer loans, of which 52% is
predominantly FHA insured or VA guaranteed and expected to
have minimal or no loss content. The remaining foreclosed
assets balance of $564 million has been written down to
estimated net realizable value. The decrease in foreclosed assets
at December 31, 2015, compared with December 31, 2014,
reflected improving credit trends as well as the continued
decline in government insured/guaranteed foreclosed assets
attributed to the adoption of ASU 2014-14, which requires that
government guaranteed residential real estate mortgage loans
that meet specific criteria be recognized as other receivables
upon foreclosure (previously, these were included in foreclosed
assets). Of the $1.4 billion in foreclosed assets at December 31,
2015, 41% have been in the foreclosed assets portfolio one year
or less.
Wells Fargo & Company
79