Wells Fargo 2015 Annual Report Download - page 53
Download and view the complete annual report
Please find page 53 of the 2015 Wells Fargo annual report below. You can navigate through the pages in the report by either clicking on the pages listed below, or by using the keyword search tool below to find specific information within the annual report.-
 1
1 -
2
-
3
-
4
-
5
-
6
-
7
-
8
-
9
-
10
-
11
-
12
-
13
-
14
-
15
-
16
-
17
-
18
-
19
-
20
-
21
-
22
-
23
-
24
-
25
-
26
-
27
-
28
-
29
-
30
-
31
-
32
-
33
-
34
-
35
-
36
-
37
-
38
-
39
-
40
-
41
-
42
-
 43
43 -
 44
44 -
 45
45 -
 46
46 -
 47
47 -
 48
48 -
 49
49 -
 50
50 -
 51
51 -
 52
52 -
 53
53 -
 54
54 -
 55
55 -
 56
56 -
 57
57 -
 58
58 -
 59
59 -
 60
60 -
 61
61 -
 62
62 -
 63
63 -
64
-
65
-
66
-
67
-
68
-
69
-
70
-
71
-
72
-
73
-
74
-
75
-
76
-
77
-
78
-
79
-
80
-
81
-
82
-
83
-
84
-
85
-
86
-
87
-
88
-
89
-
90
-
91
-
92
-
93
-
94
-
95
-
96
-
97
-
98
-
99
-
100
-
101
-
102
-
103
-
104
-
105
-
106
-
107
-
108
-
109
-
110
-
111
-
112
-
113
-
114
-
115
-
116
-
117
-
118
-
119
-
120
-
121
-
122
-
123
-
124
-
125
-
126
-
127
-
128
-
129
-
130
-
131
-
132
-
133
-
134
-
135
-
136
-
137
-
138
-
139
-
140
-
141
-
142
-
143
-
144
-
145
-
146
-
147
-
148
-
149
-
150
-
151
-
152
-
153
-
154
-
155
-
156
-
157
-
158
-
159
-
160
-
161
-
162
-
163
-
164
-
165
-
166
-
167
-
168
-
169
-
170
-
171
-
172
-
173
-
174
-
175
-
176
-
177
-
178
-
179
-
180
-
181
-
182
-
183
-
184
-
185
-
186
-
187
-
188
-
189
-
190
-
191
-
192
-
193
-
194
-
195
-
196
-
197
-
198
-
199
-
200
-
201
-
202
-
203
-
204
-
205
-
206
-
207
-
208
-
209
-
210
-
211
-
212
-
213
-
214
-
215
-
216
-
217
-
218
-
219
-
220
-
221
-
222
-
223
-
224
-
225
-
226
-
227
-
228
-
229
-
230
-
231
-
232
-
233
-
234
-
235
-
236
-
237
-
238
-
239
-
240
-
241
-
242
-
243
-
244
-
245
-
246
-
247
-
248
-
249
-
250
-
251
-
252
-
253
-
254
-
255
-
256
-
257
-
258
-
259
-
260
-
261
-
262
-
263
-
264
-
265
-
266
-
267
-
268
-
269
-
270
-
271
-
272
-
273
 |
 |

WIM reported net income of $2.3 billion in 2015, up
$256 million, or 12%, from 2014, which was up 17% from
$1.8 billion in 2013. Net income growth in 2015 and 2014 was
primarily driven by growth in net interest income, as well as
noninterest income. Revenue of $15.8 billion in 2015 increased
$508 million from 2014, which was up 7% from $14.3 billion in
2013. The increase in revenue for both 2015 and 2014 was due to
growth in both net interest income and noninterest income. Net
interest income increased 15% in 2015 and 8% in 2014 due to
growth in investment portfolios and loan balances. Average loan
balances of $60.1 billion in 2015 increased 15% from
$52.1 billion in 2014, which was up 13% from $46.2 billion in
2013. Average deposits in 2015 of $172.3 billion increased 5%
from $163.5 billion in 2014, which was up 3% from
$158.9 billion in 2013. Noninterest income increased 1% in 2015
from 2014, primarily due to growth in asset-based fees driven by
higher average client assets in 2015 than 2014, partially offset by
lower gains on deferred compensation plan investments (offset
in employee benefits expense). Noninterest income increased 6%
in 2014 from 2013, largely due to strong growth in asset-based
fees from higher client assets driven by net client asset inflows
and favorable market performance, partially offset by lower
brokerage transaction revenue. Noninterest expense of
$12.1 billion for 2015 was up 1% from $12.0 billion in 2014,
which was up 4% from $11.5 billion in 2013. The increase in 2015
was predominantly due to higher non-personnel expenses and
increased broker commissions, partially offset by lower deferred
compensation plan expense (offset in trading revenue). The
increase in 2014 was predominantly due to increased broker
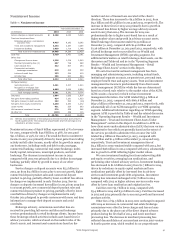
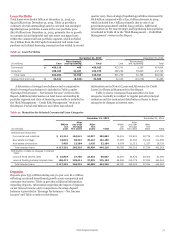
Table 9d: Retail Brokerage Client Assets
commissions and higher non-personnel expenses. The provision
for credit losses increased $25 million in 2015, driven primarily
by lower allowance releases. The provision for credit losses
decreased $34 million in 2014, driven by lower net charge-offs
and continued improvement in credit quality.
The following discussions provide additional information
for client assets we oversee in our retail brokerage advisory and
trust and investment management business lines.
Retail Brokerage Client Assets Brokerage advisory,
commissions and other fees are received for providing full-
service and discount brokerage services predominantly to retail
brokerage clients. Offering advisory account relationships to our
brokerage clients is an important component of our broader
strategy of meeting their financial needs. Although most of our
retail brokerage client assets are in accounts that earn brokerage
commissions, the fees from those accounts generally represent
transactional commissions based on the number and size of
transactions executed at the client’s direction. Fees earned from
advisory accounts are asset-based and depend on changes in the
value of the client’s assets as well as the level of assets resulting
from inflows and outflows. A major portion of our brokerage
advisory, commissions and other fee income is earned from
advisory accounts. Table 9d shows advisory account client assets
as a percentage of total retail brokerage client assets at
December 31, 2015, 2014 and 2013.
Year ended December 31,
(in billions) 2015 2014 2013
Retail brokerage client assets
Advisory account client assets
Advisory account client assets as a percentage of total client assets
$ 1,386.9
419.9
30%
1,421.8
422.8
30
1,363.6
374.8
27
Retail Brokerage advisory accounts include assets that are
financial advisor-directed and separately managed by third-
party managers, as well as certain client-directed brokerage
assets where we earn a fee for advisory and other services, but do
not have investment discretion. These advisory accounts
generate fees as a percentage of the market value of the assets,
which vary across the account types based on the distinct
services provided, and are affected by investment performance
as well as asset inflows and outflows. For the years ended
December 31, 2015, 2014 and 2013, the average fee rate by
account type ranged from 80 to 120 basis points. Table 9e
presents retail brokerage advisory account client assets activity
by account type for the years ended December 31, 2015, 2014
and 2013.
Wells Fargo & Company
51