Wells Fargo 2015 Annual Report Download - page 237
Download and view the complete annual report
Please find page 237 of the 2015 Wells Fargo annual report below. You can navigate through the pages in the report by either clicking on the pages listed below, or by using the keyword search tool below to find specific information within the annual report.-
 1
1 -
2
-
3
-
4
-
5
-
6
-
7
-
8
-
9
-
10
-
11
-
12
-
13
-
14
-
15
-
16
-
17
-
18
-
19
-
20
-
21
-
22
-
23
-
24
-
25
-
26
-
27
-
28
-
29
-
30
-
31
-
32
-
33
-
34
-
35
-
36
-
37
-
38
-
39
-
40
-
41
-
42
-
43
-
44
-
45
-
46
-
47
-
48
-
49
-
50
-
51
-
52
-
53
-
54
-
55
-
56
-
57
-
58
-
59
-
60
-
61
-
62
-
63
-
64
-
65
-
66
-
67
-
68
-
69
-
70
-
71
-
72
-
73
-
74
-
75
-
76
-
77
-
78
-
79
-
80
-
81
-
82
-
83
-
84
-
85
-
86
-
87
-
88
-
89
-
90
-
91
-
92
-
93
-
94
-
95
-
96
-
97
-
98
-
99
-
100
-
101
-
102
-
103
-
104
-
105
-
106
-
107
-
108
-
109
-
110
-
111
-
112
-
113
-
114
-
115
-
116
-
117
-
118
-
119
-
120
-
121
-
122
-
123
-
124
-
125
-
126
-
127
-
128
-
129
-
130
-
131
-
132
-
133
-
134
-
135
-
136
-
137
-
138
-
139
-
140
-
141
-
142
-
143
-
144
-
145
-
146
-
147
-
148
-
149
-
150
-
151
-
152
-
153
-
154
-
155
-
156
-
157
-
158
-
159
-
160
-
161
-
162
-
163
-
164
-
165
-
166
-
167
-
168
-
169
-
170
-
171
-
172
-
173
-
174
-
175
-
176
-
177
-
178
-
179
-
180
-
181
-
182
-
183
-
184
-
185
-
186
-
187
-
188
-
189
-
190
-
191
-
192
-
193
-
194
-
195
-
196
-
197
-
198
-
199
-
200
-
201
-
202
-
203
-
204
-
205
-
206
-
207
-
208
-
209
-
210
-
211
-
212
-
213
-
214
-
215
-
216
-
217
-
218
-
219
-
220
-
221
-
222
-
223
-
224
-
225
-
226
-
 227
227 -
 228
228 -
 229
229 -
 230
230 -
 231
231 -
 232
232 -
 233
233 -
 234
234 -
 235
235 -
 236
236 -
 237
237 -
 238
238 -
 239
239 -
 240
240 -
 241
241 -
 242
242 -
 243
243 -
 244
244 -
 245
245 -
 246
246 -
 247
247 -
248
-
249
-
250
-
251
-
252
-
253
-
254
-
255
-
256
-
257
-
258
-
259
-
260
-
261
-
262
-
263
-
264
-
265
-
266
-
267
-
268
-
269
-
270
-
271
-
272
-
273
 |
 |

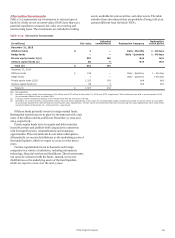
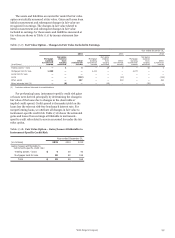
Alternative Investments assets, available-for-sale securities, and other assets. The table
Table 17.15 summarizes our investments in various types of excludes those investments that are probable of being sold at an
funds for which we use net asset values (NAVs) per share as a amount different from the funds’ NAVs.
practical expedient to measure fair value on recurring and
nonrecurring bases. The investments are included in trading
Table 17.15: Alternative Investments
Unfunded Redemption
(in millions) Fair value commitments Redemption frequency notice period
December 31, 2015
Offshore funds $ 2 — Daily - Monthly 1 - 30 days
Hedge funds — — Daily - Quarterly 1 - 90 days
Private equity funds (1)(2) 555 135 N/A N/A
Venture capital funds (2) 85 9 N/A N/A
Total (3) $ 642 144
December 31, 2014
Offshore funds
Hedge funds
Private equity funds (1)(2)
Venture capital funds (2)
$ 125
1
1,313
68
—
—
243
9
Daily - Quarterly
Daily - Quarterly
N/A
N/A
1 - 60 days
1-90 days
N/A
N/A
Total (3) $ 1,507 252
N/A - Not applicable
(1) Excludes a private equity fund investment of $0 million and $171 million at December 31, 2015 and 2014, respectively. This investment was sold in second quarter 2015
for an amount different from the fund's NAV.
(2) Includes certain investments subject to the Volcker Rule that we may have to divest.
(3) December 31, 2015 and 2014, include $602 million and $1.3 billion respectively, of fair value for nonmarketable equity investments carried at cost for which we use NAVs
as a practical expedient for determining nonrecurring fair value adjustments. The fair values of investments that had nonrecurring fair value adjustments were $154 million
and $108 million at December 31, 2015 and 2014, respectively.
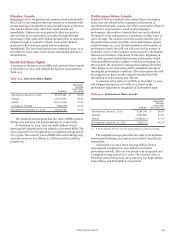
Offshore funds primarily invest in foreign mutual funds.
Redemption restrictions are in place for investments with a fair
value of $0 million and $24 million at December 31, 2015 and
2014, respectively.
Private equity funds invest in equity and debt securities
issued by private and publicly-held companies in connection
with leveraged buyouts, recapitalizations and expansion
opportunities. These investments do not allow redemptions.
Alternatively, we receive distributions as the underlying assets of
the funds liquidate, which we expect to occur over the next 2
years.
Venture capital funds invest in domestic and foreign
companies in a variety of industries, including information
technology, financial services and healthcare. These investments
can never be redeemed with the funds. Instead, we receive
distributions as the underlying assets of the fund liquidate,
which we expect to occur over the next 5 years.
Wells Fargo & Company
235