Wells Fargo 2015 Annual Report Download - page 165
Download and view the complete annual report
Please find page 165 of the 2015 Wells Fargo annual report below. You can navigate through the pages in the report by either clicking on the pages listed below, or by using the keyword search tool below to find specific information within the annual report.-
 1
1 -
2
-
3
-
4
-
5
-
6
-
7
-
8
-
9
-
10
-
11
-
12
-
13
-
14
-
15
-
16
-
17
-
18
-
19
-
20
-
21
-
22
-
23
-
24
-
25
-
26
-
27
-
28
-
29
-
30
-
31
-
32
-
33
-
34
-
35
-
36
-
37
-
38
-
39
-
40
-
41
-
42
-
43
-
44
-
45
-
46
-
47
-
48
-
49
-
50
-
51
-
52
-
53
-
54
-
55
-
56
-
57
-
58
-
59
-
60
-
61
-
62
-
63
-
64
-
65
-
66
-
67
-
68
-
69
-
70
-
71
-
72
-
73
-
74
-
75
-
76
-
77
-
78
-
79
-
80
-
81
-
82
-
83
-
84
-
85
-
86
-
87
-
88
-
89
-
90
-
91
-
92
-
93
-
94
-
95
-
96
-
97
-
98
-
99
-
100
-
101
-
102
-
103
-
104
-
105
-
106
-
107
-
108
-
109
-
110
-
111
-
112
-
113
-
114
-
115
-
116
-
117
-
118
-
119
-
120
-
121
-
122
-
123
-
124
-
125
-
126
-
127
-
128
-
129
-
130
-
131
-
132
-
133
-
134
-
135
-
136
-
137
-
138
-
139
-
140
-
141
-
142
-
143
-
144
-
145
-
146
-
147
-
148
-
149
-
150
-
151
-
152
-
153
-
154
-
 155
155 -
 156
156 -
 157
157 -
 158
158 -
 159
159 -
 160
160 -
 161
161 -
 162
162 -
 163
163 -
 164
164 -
 165
165 -
 166
166 -
 167
167 -
 168
168 -
 169
169 -
 170
170 -
 171
171 -
 172
172 -
 173
173 -
 174
174 -
 175
175 -
176
-
177
-
178
-
179
-
180
-
181
-
182
-
183
-
184
-
185
-
186
-
187
-
188
-
189
-
190
-
191
-
192
-
193
-
194
-
195
-
196
-
197
-
198
-
199
-
200
-
201
-
202
-
203
-
204
-
205
-
206
-
207
-
208
-
209
-
210
-
211
-
212
-
213
-
214
-
215
-
216
-
217
-
218
-
219
-
220
-
221
-
222
-
223
-
224
-
225
-
226
-
227
-
228
-
229
-
230
-
231
-
232
-
233
-
234
-
235
-
236
-
237
-
238
-
239
-
240
-
241
-
242
-
243
-
244
-
245
-
246
-
247
-
248
-
249
-
250
-
251
-
252
-
253
-
254
-
255
-
256
-
257
-
258
-
259
-
260
-
261
-
262
-
263
-
264
-
265
-
266
-
267
-
268
-
269
-
270
-
271
-
272
-
273
 |
 |

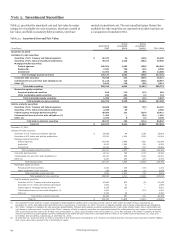
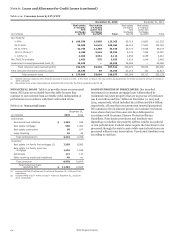
Loan Concentrations
Loan concentrations may exist when there are amounts loaned
to borrowers engaged in similar activities or similar types of
loans extended to a diverse group of borrowers that would cause
them to be similarly impacted by economic or other conditions.
At December 31, 2015 and 2014, we did not have concentrations
representing 10% or more of our total loan portfolio in domestic
commercial and industrial loans and lease financing by industry
or CRE loans (real estate mortgage and real estate construction)
by state or property type. Our real estate 1-4 family mortgage
loans to borrowers in the state of California represented
approximately 13% of total loans at both December 31, 2015 and
2014, of which 2% were PCI loans in both years. These California
loans are generally diversified among the larger metropolitan
areas in California, with no single area consisting of more than
5% of total loans. We continuously monitor changes in real
estate values and underlying economic or market conditions for
all geographic areas of our real estate 1-4 family mortgage
portfolio as part of our credit risk management process.
Some of our real estate 1-4 family first and junior lien
mortgage loans include an interest-only feature as part of the
loan terms. These interest-only loans were approximately 9% of
total loans at December 31, 2015, and 12% at December 31, 2014.
Substantially all of these interest-only loans at origination were
considered to be prime or near prime. We do not offer option
adjustable-rate mortgage (ARM) products, nor do we offer
variable-rate mortgage products with fixed payment amounts,
commonly referred to within the financial services industry as
negative amortizing mortgage loans. We acquired an option
payment loan portfolio (Pick-a-Pay) from Wachovia at
December 31, 2008. A majority of the portfolio was identified as
PCI loans. Since the acquisition, we have reduced our exposure
to the option payment portion of the portfolio through our
modification efforts and loss mitigation actions. At December 31,
2015, approximately 2% of total loans remained with the
payment option feature compared with 10% at December 31,
2008.
Our first and junior lien lines of credit products generally
have a draw period of 10 years (with some up to 15 or 20 years)
with variable interest rate and payment options during the draw
period of (1) interest only or (2) 1.5% of total outstanding
balance plus accrued interest. During the draw period, the
borrower has the option of converting all or a portion of the line
from a variable interest rate to a fixed rate with terms including
interest-only payments for a fixed period between three to seven
years or a fully amortizing payment with a fixed period between
five to 30 years. At the end of the draw period, a line of credit
generally converts to an amortizing payment schedule with
repayment terms of up to 30 years based on the balance at time
of conversion. At December 31, 2015, our lines of credit portfolio
had an outstanding balance of $63.6 billion, of which
$9.6 billion, or 15%, is in its amortization period, another
$11.3 billion, or 18%, of our total outstanding balance, will reach
their end of draw period during 2016 through 2017, $6.8 billion,
or 11%, during 2018 through 2020, and $35.9 billion, or 56%,
will convert in subsequent years. This portfolio had unfunded
credit commitments of $67.7 billion at December 31, 2015. The
lines that enter their amortization period may experience higher
delinquencies and higher loss rates than the ones in their draw
period. At December 31, 2015, $506 million, or 5%, of
outstanding lines of credit that are in their amortization period
were 30 or more days past due, compared with $937 million, or
2%, for lines in their draw period. We have considered this
increased inherent risk in our allowance for credit loss estimate.
In anticipation of our borrowers reaching the end of their
contractual commitment, we have created a program to inform,
educate and help these borrowers transition from interest-only
to fully-amortizing payments or full repayment. We monitor the
performance of the borrowers moving through the program in
an effort to refine our ongoing program strategy.
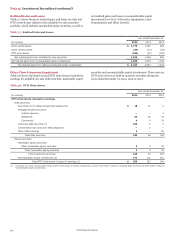
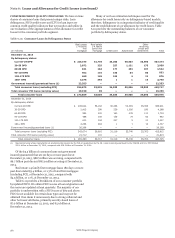
Loan Purchases, Sales, and Transfers
Table 6.3 summarizes the proceeds paid or received for
purchases and sales of loans and transfers from loans held for
investment to mortgages/loans held for sale at lower of cost or
fair value. This loan activity primarily includes loans purchased
and sales of whole loan or participating interests, whereby we
receive or transfer a portion of a loan after origination. The table
excludes PCI loans and loans recorded at fair value, including
loans originated for sale because their loan activity normally
does not impact the allowance for credit losses.
Table 6.3: Loan Purchases, Sales, and Transfers
Year ended December 31,
2015 2014
(in millions) Commercial Consumer Total Commercial Consumer Total
Purchases (1) $ 13,674 340 14,014 4,952 1,365 6,317
Sales (1) (1,214) (160) (1,374) (1,706) (152) (1,858)
Transfers to MHFS/LHFS (1) (91) (16) (107) (99) (9,778) (9,877)
(1) All categories exclude activity in government insured/guaranteed real estate 1-4 family first mortgage loans. As servicer, we are able to buy delinquent insured/guaranteed
loans out of the Government National Mortgage Association (GNMA) pools, and manage and/or resell them in accordance with applicable requirements. These loans are
predominantly insured by the Federal Housing Administration (FHA) or guaranteed by the Department of Veterans Affairs (VA). Accordingly, these loans have limited impact
on the allowance for loan losses.
Commitments to Lend
A commitment to lend is a legally binding agreement to lend consumer commitments, including home equity lines and credit
funds to a customer, usually at a stated interest rate, if funded, card lines, in accordance with the contracts and applicable law.
and for specific purposes and time periods. We generally require We may, as a representative for other lenders, advance
a fee to extend such commitments. Certain commitments are funds or provide for the issuance of letters of credit under
subject to loan agreements with covenants regarding the syndicated loan or letter of credit agreements. Any advances are
financial performance of the customer or borrowing base generally repaid in less than a week and would normally require
formulas on an ongoing basis that must be met before we are default of both the customer and another lender to expose us to
required to fund the commitment. We may reduce or cancel loss. These temporary advance arrangements totaled
Wells Fargo & Company
163