Wells Fargo 2015 Annual Report Download - page 267
Download and view the complete annual report
Please find page 267 of the 2015 Wells Fargo annual report below. You can navigate through the pages in the report by either clicking on the pages listed below, or by using the keyword search tool below to find specific information within the annual report.-
 1
1 -
2
-
3
-
4
-
5
-
6
-
7
-
8
-
9
-
10
-
11
-
12
-
13
-
14
-
15
-
16
-
17
-
18
-
19
-
20
-
21
-
22
-
23
-
24
-
25
-
26
-
27
-
28
-
29
-
30
-
31
-
32
-
33
-
34
-
35
-
36
-
37
-
38
-
39
-
40
-
41
-
42
-
43
-
44
-
45
-
46
-
47
-
48
-
49
-
50
-
51
-
52
-
53
-
54
-
55
-
56
-
57
-
58
-
59
-
60
-
61
-
62
-
63
-
64
-
65
-
66
-
67
-
68
-
69
-
70
-
71
-
72
-
73
-
74
-
75
-
76
-
77
-
78
-
79
-
80
-
81
-
82
-
83
-
84
-
85
-
86
-
87
-
88
-
89
-
90
-
91
-
92
-
93
-
94
-
95
-
96
-
97
-
98
-
99
-
100
-
101
-
102
-
103
-
104
-
105
-
106
-
107
-
108
-
109
-
110
-
111
-
112
-
113
-
114
-
115
-
116
-
117
-
118
-
119
-
120
-
121
-
122
-
123
-
124
-
125
-
126
-
127
-
128
-
129
-
130
-
131
-
132
-
133
-
134
-
135
-
136
-
137
-
138
-
139
-
140
-
141
-
142
-
143
-
144
-
145
-
146
-
147
-
148
-
149
-
150
-
151
-
152
-
153
-
154
-
155
-
156
-
157
-
158
-
159
-
160
-
161
-
162
-
163
-
164
-
165
-
166
-
167
-
168
-
169
-
170
-
171
-
172
-
173
-
174
-
175
-
176
-
177
-
178
-
179
-
180
-
181
-
182
-
183
-
184
-
185
-
186
-
187
-
188
-
189
-
190
-
191
-
192
-
193
-
194
-
195
-
196
-
197
-
198
-
199
-
200
-
201
-
202
-
203
-
204
-
205
-
206
-
207
-
208
-
209
-
210
-
211
-
212
-
213
-
214
-
215
-
216
-
217
-
218
-
219
-
220
-
221
-
222
-
223
-
224
-
225
-
226
-
227
-
228
-
229
-
230
-
231
-
232
-
233
-
234
-
235
-
236
-
237
-
238
-
239
-
240
-
241
-
242
-
243
-
244
-
245
-
246
-
247
-
248
-
249
-
250
-
251
-
252
-
253
-
254
-
255
-
256
-
 257
257 -
 258
258 -
 259
259 -
 260
260 -
 261
261 -
 262
262 -
 263
263 -
 264
264 -
 265
265 -
 266
266 -
 267
267 -
 268
268 -
 269
269 -
 270
270 -
 271
271 -
 272
272 -
 273
273
 |
 |

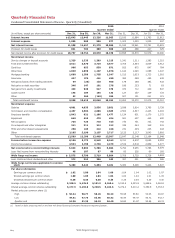
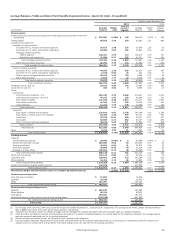
Average Balances, Yields and Rates Paid (Taxable-Equivalent basis) - Quarterly (1)(2) - (Unaudited)
Quarter ended December 31,
2015 2014
(in millions)
Average
balance
Yields/
rates
Interest
income/
expense
Average
balance
Yields/
rates
Interest
income/
expense
Earning assets
Federal funds sold, securities purchased under resale agreements and other short-term
investments $ 274,589 0.28% $ 195 268,109 0.28% $ 188
Trading assets 68,833 3.33 573 60,383 3.21 485
Investment securities (3):
Available-for-sale securities:
Securities of U.S. Treasury and federal agencies 34,617 1.58 137 19,506 1.55 76
Securities of U.S. states and political subdivisions 49,300 4.37 539 43,891 4.30 472
Mortgage-backed securities:
Federal agencies 102,281 2.79 712 109,270 2.78 760
Residential and commercial 21,502 5.51 297 24,711 5.89 364
Total mortgage-backed securities 123,783 3.26 1,009 133,981 3.36 1,124
Other debt and equity securities 52,701 3.35 444 44,980 3.87 438
Total available-for-sale securities 260,401 3.27 2,129 242,358 3.48 2,110
Held-to-maturity securities:
Securities of U.S. Treasury and federal agencies 44,656 2.18 246 32,930 2.25 187
Securities of U.S. states and political subdivisions 2,158 6.07 33 902 4.92 11
Federal agency mortgage-backed securities 28,185 2.42 170 5,586 2.07 29
Other debt securities 4,876 1.77 22 6,118 1.81 27
Total held-to-maturity securities 79,875 2.35 471 45,536 2.22 254
Total investment securities 340,276 3.05 2,600 287,894 3.28 2,364
Mortgages held for sale (4) 19,189 3.66 176 19,191 3.90 187
Loans held for sale (4) 363 4.96 5 6,968 1.43 25
Loans:
Commercial:
Commercial and industrial - U.S. 250,445 3.25 2,048 218,297 3.32 1,825
Commercial and industrial - Non U.S. 47,972 1.97 239 43,049 2.03 221
Real estate mortgage 121,844 3.30 1,012 112,277 3.69 1,044
Real estate construction 21,993 3.27 182 18,336 4.33 200
Lease financing 12,241 4.48 136 12,268 5.35 164
Total commercial 454,495 3.16 3,617 404,227 3.39 3,454
Consumer:
Real estate 1-4 family first mortgage 272,871 4.04 2,759 264,799 4.16 2,754
Real estate 1-4 family junior lien mortgage 53,788 4.28 579 60,177 4.28 648
Credit card 32,795 11.61 960 29,477 11.71 870
Automobile 59,505 5.74 862 55,457 6.08 849
Other revolving credit and installment 38,826 5.83 571 35,292 6.01 534
Total consumer 457,785 4.99 5,731 445,202 5.06 5,655
Total loans (4) 912,280 4.08 9,348 849,429 4.27 9,109
Other 5,166 4.82 61 4,829 5.30 64
Total earning assets $ 1,620,696 3.18% $ 12,958 1,496,803 3.31% $ 12,422
Funding sources
Deposits:
Interest-bearing checking $ 39,082 0.05% $ 5 40,498 0.06% $ 6
Market rate and other savings 640,503 0.06 93 593,940 0.07 99
Savings certificates 29,654 0.54 41 35,870 0.80 72
Other time deposits 49,806 0.52 64 56,119 0.39 55
Deposits in foreign offices 107,094 0.14 38 99,289 0.15 37
Total interest-bearing deposits 866,139 0.11 241 825,716 0.13 269
Short-term borrowings 102,915 0.05 12 64,676 0.12 19
Long-term debt 190,861 1.49 713 183,286 1.35 620
Other liabilities 16,453 2.14 88 15,580 2.44 96
Total interest-bearing liabilities 1,176,368 0.36 1,054 1,089,258 0.37 1,004
Portion of noninterest-bearing funding sources 444,328 407,545 — —
Total funding sources $ 1,620,696 0.26 1,054 1,496,803 0.27 1,004
Net interest margin and net interest income on a taxable-equivalent basis (5) 2.92% $ 11,904 3.04% $ 11,418
Noninterest-earning assets
Cash and due from banks $ 17,804 16,932
Goodwill 25,580 25,705
Other 123,207 124,320
Total noninterest-earning assets $ 166,591 166,957
Noninterest-bearing funding sources
Deposits $ 350,670 324,080
Other liabilities 65,224 65,672
Total equity 195,025 184,750
Noninterest-bearing funding sources used to fund earning assets (444,328) (407,545)
Net noninterest-bearing funding sources $ 166,591 166,957
Total assets $ 1,787,287 1,663,760
(1) Our average prime rate was 3.29% and 3.25% for the quarters ended December 31, 2015 and 2014, respectively. The average three-month London Interbank Offered
Rate (LIBOR) was 0.41% and 0.24% for the same quarters, respectively.
(2) Yield/rates and amounts include the effects of hedge and risk management activities associated with the respective asset and liability categories.
(3) Yields and rates are based on interest income/expense amounts for the period, annualized based on the accrual basis for the respective accounts. The average balance
amounts represent amortized cost for the periods presented.
(4) Nonaccrual loans and related income are included in their respective loan categories.
(5) Includes taxable-equivalent adjustments of $316 million and $238 million for the quarters ended December 31, 2015 and 2014, respectively, primarily related to tax-
exempt income on certain loans and securities. The federal statutory tax rate was 35% for the periods presented.
Wells Fargo & Company
265