Wells Fargo 2015 Annual Report Download - page 58
Download and view the complete annual report
Please find page 58 of the 2015 Wells Fargo annual report below. You can navigate through the pages in the report by either clicking on the pages listed below, or by using the keyword search tool below to find specific information within the annual report.-
 1
1 -
2
-
3
-
4
-
5
-
6
-
7
-
8
-
9
-
10
-
11
-
12
-
13
-
14
-
15
-
16
-
17
-
18
-
19
-
20
-
21
-
22
-
23
-
24
-
25
-
26
-
27
-
28
-
29
-
30
-
31
-
32
-
33
-
34
-
35
-
36
-
37
-
38
-
39
-
40
-
41
-
42
-
43
-
44
-
45
-
46
-
47
-
 48
48 -
 49
49 -
 50
50 -
 51
51 -
 52
52 -
 53
53 -
 54
54 -
 55
55 -
 56
56 -
 57
57 -
 58
58 -
 59
59 -
 60
60 -
 61
61 -
 62
62 -
 63
63 -
 64
64 -
 65
65 -
 66
66 -
 67
67 -
 68
68 -
69
-
70
-
71
-
72
-
73
-
74
-
75
-
76
-
77
-
78
-
79
-
80
-
81
-
82
-
83
-
84
-
85
-
86
-
87
-
88
-
89
-
90
-
91
-
92
-
93
-
94
-
95
-
96
-
97
-
98
-
99
-
100
-
101
-
102
-
103
-
104
-
105
-
106
-
107
-
108
-
109
-
110
-
111
-
112
-
113
-
114
-
115
-
116
-
117
-
118
-
119
-
120
-
121
-
122
-
123
-
124
-
125
-
126
-
127
-
128
-
129
-
130
-
131
-
132
-
133
-
134
-
135
-
136
-
137
-
138
-
139
-
140
-
141
-
142
-
143
-
144
-
145
-
146
-
147
-
148
-
149
-
150
-
151
-
152
-
153
-
154
-
155
-
156
-
157
-
158
-
159
-
160
-
161
-
162
-
163
-
164
-
165
-
166
-
167
-
168
-
169
-
170
-
171
-
172
-
173
-
174
-
175
-
176
-
177
-
178
-
179
-
180
-
181
-
182
-
183
-
184
-
185
-
186
-
187
-
188
-
189
-
190
-
191
-
192
-
193
-
194
-
195
-
196
-
197
-
198
-
199
-
200
-
201
-
202
-
203
-
204
-
205
-
206
-
207
-
208
-
209
-
210
-
211
-
212
-
213
-
214
-
215
-
216
-
217
-
218
-
219
-
220
-
221
-
222
-
223
-
224
-
225
-
226
-
227
-
228
-
229
-
230
-
231
-
232
-
233
-
234
-
235
-
236
-
237
-
238
-
239
-
240
-
241
-
242
-
243
-
244
-
245
-
246
-
247
-
248
-
249
-
250
-
251
-
252
-
253
-
254
-
255
-
256
-
257
-
258
-
259
-
260
-
261
-
262
-
263
-
264
-
265
-
266
-
267
-
268
-
269
-
270
-
271
-
272
-
273
 |
 |

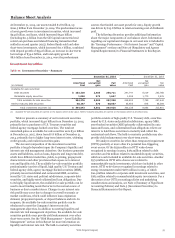
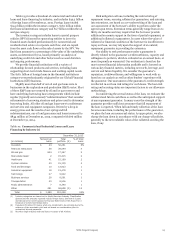
Balance Sheet Analysis (continued)
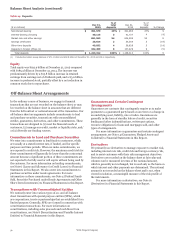
Table 14: Deposits
($ in millions)
Dec 31,
2015
% of
total
deposits
Dec 31,
2014
% of
total
deposits % Change
Noninterest-bearing
Interest-bearing checking
Market rate and other savings
Savings certificates
Other time deposits
Deposits in foreign offices (1)
$ 351,579
40,115
651,563
28,614
49,032
102,409
29%
3
54
2
4
8
$ 321,963
41,737
604,999
35,354
56,828
107,429
27%
4
52
3
5
9
9
(4)
8
(19)
(14)
(5)
Total deposits $ 1,223,312 100% $ 1,168,310 100% 5
(1) Includes Eurodollar sweep balances of $71.1 billion and $69.8 billion at December 31, 2015 and 2014, respectively.
Equity
Total equity was $193.9 billion at December 31, 2015 compared
with $185.3 billion at December 31, 2014. The increase was
predominantly driven by a $13.8 billion increase in retained
earnings from earnings net of dividends paid, and a $3.0 billion
increase in preferred stock, partially offset by a net reduction in
common stock due to repurchases.
Off-Balance Sheet Arrangements
In the ordinary course of business, we engage in financial
transactions that are not recorded on the balance sheet, or may
be recorded on the balance sheet in amounts that are different
from the full contract or notional amount of the transaction. Our
off-balance sheet arrangements include commitments to lend
and purchase securities, transactions with unconsolidated
entities, guarantees, derivatives, and other commitments. These
transactions are designed to (1) meet the financial needs of
customers, (2) manage our credit, market or liquidity risks, and/
or (3) diversify our funding sources.
Commitments to Lend and Purchase Securities
We enter into commitments to lend funds to customers, which
are usually at a stated interest rate, if funded, and for specific
purposes and time periods. When we make commitments, we
are exposed to credit risk. However, the maximum credit risk for
these commitments will generally be lower than the contractual
amount because a significant portion of these commitments are
not expected to be fully used or will expire without being used by
the customer. For more information on lending commitments,
see Note 6 (Loans and Allowance for Credit Losses) to Financial
Statements in this Report. We also enter into commitments to
purchase securities under resale agreements. For more
information on these commitments, see Note 4 (Federal Funds
Sold, Securities Purchased under Resale Agreements and Other
Short-Term Investments) to Financial Statements in this Report.
Transactions with Unconsolidated Entities
We routinely enter into various types of on- and off-balance
sheet transactions with special purpose entities (SPEs), which
are corporations, trusts or partnerships that are established for a
limited purpose. Generally, SPEs are formed in connection with
securitization transactions. For more information on
securitizations, including sales proceeds and cash flows from
securitizations, see Note 8 (Securitizations and Variable Interest
Entities) to Financial Statements in this Report.
Guarantees and Certain Contingent
Arrangements
Guarantees are contracts that contingently require us to make
payments to a guaranteed party based on an event or a change in
an underlying asset, liability, rate or index. Guarantees are
generally in the form of standby letters of credit, securities
lending and other indemnifications, written put options,
recourse obligations for loans and mortgages sold, and other
types of arrangements.
For more information on guarantees and certain contingent
arrangements, see Note 14 (Guarantees, Pledged Assets and
Collateral) to Financial Statements in this Report.
Derivatives
We primarily use derivatives to manage exposure to market risk,
including interest rate risk, credit risk and foreign currency risk,
and to assist customers with their risk management objectives.
Derivatives are recorded on the balance sheet at fair value and
volumes can be measured in terms of the notional amount,
which is generally not exchanged, but is used only as the basis on
which interest and other payments are determined. The notional
amount is not recorded on the balance sheet and is not, when
viewed in isolation, a meaningful measure of the risk profile of
the instruments.
For more information on derivatives, see Note 16
(Derivatives) to Financial Statements in this Report.
Wells Fargo & Company
56