Wells Fargo 2015 Annual Report Download - page 92
Download and view the complete annual report
Please find page 92 of the 2015 Wells Fargo annual report below. You can navigate through the pages in the report by either clicking on the pages listed below, or by using the keyword search tool below to find specific information within the annual report.-
 1
1 -
2
-
3
-
4
-
5
-
6
-
7
-
8
-
9
-
10
-
11
-
12
-
13
-
14
-
15
-
16
-
17
-
18
-
19
-
20
-
21
-
22
-
23
-
24
-
25
-
26
-
27
-
28
-
29
-
30
-
31
-
32
-
33
-
34
-
35
-
36
-
37
-
38
-
39
-
40
-
41
-
42
-
43
-
44
-
45
-
46
-
47
-
48
-
49
-
50
-
51
-
52
-
53
-
54
-
55
-
56
-
57
-
58
-
59
-
60
-
61
-
62
-
63
-
64
-
65
-
66
-
67
-
68
-
69
-
70
-
71
-
72
-
73
-
74
-
75
-
76
-
77
-
78
-
79
-
80
-
81
-
 82
82 -
 83
83 -
 84
84 -
 85
85 -
 86
86 -
 87
87 -
 88
88 -
 89
89 -
 90
90 -
 91
91 -
 92
92 -
 93
93 -
 94
94 -
 95
95 -
 96
96 -
 97
97 -
 98
98 -
 99
99 -
 100
100 -
 101
101 -
 102
102 -
103
-
104
-
105
-
106
-
107
-
108
-
109
-
110
-
111
-
112
-
113
-
114
-
115
-
116
-
117
-
118
-
119
-
120
-
121
-
122
-
123
-
124
-
125
-
126
-
127
-
128
-
129
-
130
-
131
-
132
-
133
-
134
-
135
-
136
-
137
-
138
-
139
-
140
-
141
-
142
-
143
-
144
-
145
-
146
-
147
-
148
-
149
-
150
-
151
-
152
-
153
-
154
-
155
-
156
-
157
-
158
-
159
-
160
-
161
-
162
-
163
-
164
-
165
-
166
-
167
-
168
-
169
-
170
-
171
-
172
-
173
-
174
-
175
-
176
-
177
-
178
-
179
-
180
-
181
-
182
-
183
-
184
-
185
-
186
-
187
-
188
-
189
-
190
-
191
-
192
-
193
-
194
-
195
-
196
-
197
-
198
-
199
-
200
-
201
-
202
-
203
-
204
-
205
-
206
-
207
-
208
-
209
-
210
-
211
-
212
-
213
-
214
-
215
-
216
-
217
-
218
-
219
-
220
-
221
-
222
-
223
-
224
-
225
-
226
-
227
-
228
-
229
-
230
-
231
-
232
-
233
-
234
-
235
-
236
-
237
-
238
-
239
-
240
-
241
-
242
-
243
-
244
-
245
-
246
-
247
-
248
-
249
-
250
-
251
-
252
-
253
-
254
-
255
-
256
-
257
-
258
-
259
-
260
-
261
-
262
-
263
-
264
-
265
-
266
-
267
-
268
-
269
-
270
-
271
-
272
-
273
 |
 |
Risk Management - Asset/Liability Management (continued)
resulting from a decline in interest rates because the potential
increase in origination/servicing fees in that scenario provides a
partial “natural business hedge.” An increase in interest rates
generally reduces the propensity for refinancing, extends the
expected duration of the servicing portfolio and, therefore,
increases the estimated fair value of the MSRs. However, an
increase in interest rates can also reduce mortgage loan demand
and, therefore, reduce origination income.
The price risk associated with our MSRs is economically
hedged with a combination of highly liquid interest rate forward
instruments including mortgage forward contracts, interest rate
swaps and interest rate options. All of the instruments included
in the hedge are marked to market daily. Because the hedging
instruments are traded in highly liquid markets, their prices are
readily observable and are fully reflected in each quarter’s mark
to market. Quarterly MSR hedging results include a combination
of directional gain or loss due to market changes as well as any
carry income generated. If the economic hedge is effective, its
overall directional hedge gain or loss will offset the change in the
valuation of the underlying MSR asset. Gains or losses
associated with these economic hedges are included in mortgage
banking noninterest income. Consistent with our longstanding
approach to hedging interest rate risk in the mortgage business,
the size of the hedge and the particular combination of forward
hedging instruments at any point in time is designed to reduce
the volatility of the mortgage business’s earnings over various
time frames within a range of mortgage interest rates. Because
market factors, the composition of the mortgage servicing
portfolio and the relationship between the origination and
servicing sides of our mortgage business change continually, the
types of instruments used in our hedging are reviewed daily and
rebalanced based on our evaluation of current market factors
and the interest rate risk inherent in our MSRs portfolio.
Throughout 2015, our economic hedging strategy generally used
forward mortgage purchase contracts that were effective at
offsetting the impact of interest rates on the value of the MSR
asset.
Mortgage forward contracts are designed to pass the full
economics of the underlying reference mortgage securities to the
holder of the contract, including both the directional gain and
loss from the forward delivery of the reference securities and the
corresponding carry income. Carry income represents the
contract’s price accretion from the forward delivery price to the
spot price including both the yield earned on the reference
securities and the market implied cost of financing during the
period. The actual amount of carry income earned on the hedge
each quarter will depend on the amount of the underlying asset
that is hedged and the particular instruments included in the
hedge. The level of carry income is driven by the slope of the
yield curve and other market driven supply and demand factors
affecting the specific reference securities. A steep yield curve
generally produces higher carry income while a flat or inverted
yield curve can result in lower or potentially negative carry
income. The level of carry income is also affected by the type of
instrument used. In general, mortgage forward contracts tend to
produce higher carry income than interest rate swap contracts.
Carry income is recognized over the life of the mortgage forward
as a component of the contract’s mark to market gain or loss.
Hedging the various sources of interest rate risk in mortgage
banking is a complex process that requires sophisticated
modeling and constant monitoring. While we attempt to balance
these various aspects of the mortgage business, there are several
potential risks to earnings:
• Valuation changes for MSRs associated with interest rate
changes are recorded in earnings immediately within the
accounting period in which those interest rate changes
occur, whereas the impact of those same changes in interest
rates on origination and servicing fees occur with a lag and
over time. Thus, the mortgage business could be protected
from adverse changes in interest rates over a period of time
on a cumulative basis but still display large variations in
income from one accounting period to the next.
• The degree to which our net gains on loan originations
offsets valuation changes for MSRs is imperfect, varies at
different points in the interest rate cycle, and depends not
just on the direction of interest rates but on the pattern of
quarterly interest rate changes.
• Origination volumes, the valuation of MSRs and hedging
results and associated costs are also affected by many
factors. Such factors include the mix of new business
between ARMs and fixed-rate mortgages, the relationship
between short-term and long-term interest rates, the degree
of volatility in interest rates, the relationship between
mortgage interest rates and other interest rate markets, and
other interest rate factors. Additional factors that can
impact the valuation of the MSRs include changes in
servicing and foreclosure costs due to changes in investor or
regulatory guidelines, as well as individual state foreclosure
legislation, and changes in discount rates due to market
participants requiring a higher return due to updated
market expectations on costs and risks associated with
investing in MSRs. Many of these factors are hard to predict
and we may not be able to directly or perfectly hedge their
effect.
• While our hedging activities are designed to balance our
mortgage banking interest rate risks, the financial
instruments we use may not perfectly correlate with the
values and income being hedged. For example, the change
in the value of ARM production held for sale from changes
in mortgage interest rates may or may not be fully offset by
Treasury and LIBOR index-based financial instruments
used as economic hedges for such ARMs. Additionally,
hedge-carry income we earn on our economic hedges for the
MSRs may not continue if the spread between short-term
and long-term rates decreases, or there are other changes in
the market for mortgage forwards that affect the implied
carry.
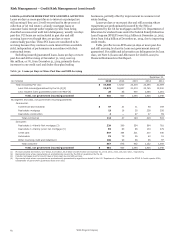
The total carrying value of our residential and commercial
MSRs was $13.7 billion and $14.0 billion at December 31, 2015
and 2014, respectively. The weighted-average note rate on our
portfolio of loans serviced for others was 4.37% and 4.45% at
December 31, 2015 and 2014, respectively. The carrying value of
our total MSRs represented 0.77% and 0.75% of mortgage loans
serviced for others at December 31, 2015 and 2014, respectively.
As part of our mortgage banking activities, we enter into
commitments to fund residential mortgage loans at specified
times in the future. A mortgage loan commitment is an interest
rate lock that binds us to lend funds to a potential borrower at a
specified interest rate and within a specified period of time,
generally up to 60 days after inception of the rate lock. These
loan commitments are derivative loan commitments if the loans
that will result from the exercise of the commitments will be held
for sale. These derivative loan commitments are recognized at
fair value on the balance sheet with changes in their fair values
recorded as part of mortgage banking noninterest income. The
fair value of these commitments include, at inception and during
the life of the loan commitment, the expected net future cash
flows related to the associated servicing of the loan as part of the
fair value measurement of derivative loan commitments.
Wells Fargo & Company
90