Wells Fargo 2015 Annual Report Download - page 216
Download and view the complete annual report
Please find page 216 of the 2015 Wells Fargo annual report below. You can navigate through the pages in the report by either clicking on the pages listed below, or by using the keyword search tool below to find specific information within the annual report.-
 1
1 -
2
-
3
-
4
-
5
-
6
-
7
-
8
-
9
-
10
-
11
-
12
-
13
-
14
-
15
-
16
-
17
-
18
-
19
-
20
-
21
-
22
-
23
-
24
-
25
-
26
-
27
-
28
-
29
-
30
-
31
-
32
-
33
-
34
-
35
-
36
-
37
-
38
-
39
-
40
-
41
-
42
-
43
-
44
-
45
-
46
-
47
-
48
-
49
-
50
-
51
-
52
-
53
-
54
-
55
-
56
-
57
-
58
-
59
-
60
-
61
-
62
-
63
-
64
-
65
-
66
-
67
-
68
-
69
-
70
-
71
-
72
-
73
-
74
-
75
-
76
-
77
-
78
-
79
-
80
-
81
-
82
-
83
-
84
-
85
-
86
-
87
-
88
-
89
-
90
-
91
-
92
-
93
-
94
-
95
-
96
-
97
-
98
-
99
-
100
-
101
-
102
-
103
-
104
-
105
-
106
-
107
-
108
-
109
-
110
-
111
-
112
-
113
-
114
-
115
-
116
-
117
-
118
-
119
-
120
-
121
-
122
-
123
-
124
-
125
-
126
-
127
-
128
-
129
-
130
-
131
-
132
-
133
-
134
-
135
-
136
-
137
-
138
-
139
-
140
-
141
-
142
-
143
-
144
-
145
-
146
-
147
-
148
-
149
-
150
-
151
-
152
-
153
-
154
-
155
-
156
-
157
-
158
-
159
-
160
-
161
-
162
-
163
-
164
-
165
-
166
-
167
-
168
-
169
-
170
-
171
-
172
-
173
-
174
-
175
-
176
-
177
-
178
-
179
-
180
-
181
-
182
-
183
-
184
-
185
-
186
-
187
-
188
-
189
-
190
-
191
-
192
-
193
-
194
-
195
-
196
-
197
-
198
-
199
-
200
-
201
-
202
-
203
-
204
-
205
-
 206
206 -
 207
207 -
 208
208 -
 209
209 -
 210
210 -
 211
211 -
 212
212 -
 213
213 -
 214
214 -
 215
215 -
 216
216 -
 217
217 -
 218
218 -
 219
219 -
 220
220 -
 221
221 -
 222
222 -
 223
223 -
 224
224 -
 225
225 -
 226
226 -
227
-
228
-
229
-
230
-
231
-
232
-
233
-
234
-
235
-
236
-
237
-
238
-
239
-
240
-
241
-
242
-
243
-
244
-
245
-
246
-
247
-
248
-
249
-
250
-
251
-
252
-
253
-
254
-
255
-
256
-
257
-
258
-
259
-
260
-
261
-
262
-
263
-
264
-
265
-
266
-
267
-
268
-
269
-
270
-
271
-
272
-
273
 |
 |

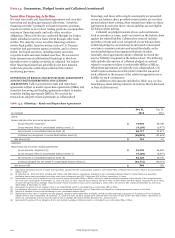
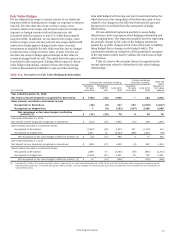
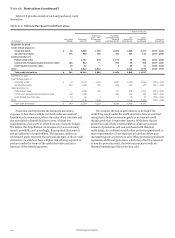
Note 16: Derivatives (continued)
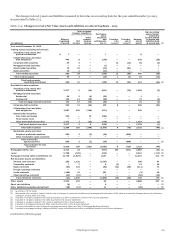
Table 16.6 provides details of sold and purchased credit
derivatives.
Table 16.6: Sold and Purchased Credit Derivatives
Notional amount
Protection Protection
(in millions)
Fair value
liability
Protection
sold (A)
sold - non-
investment
grade
purchased with
identical
underlyings (B)
Net
protection
sold (A)-(B)
Other
protection
purchased
Range of
maturities
December 31, 2015
Credit default swaps on:
Corporate bonds $ 44 4,838 1,745 3,602 1,236 2,272 2016 - 2025
Structured products 275 598 463 395 203 142 2017 - 2047
Credit protection on:
Default swap index — 1,727 370 1,717 10 960 2016 - 2020
Commercial mortgage-backed securities index 203 822 — 766 56 316 2047 - 2057
Asset-backed securities index 18 47 — 1 46 71 2045 - 2046
Other 1 2,512 2,512 — 2,512 7,776 2016 - 2025
Total credit derivatives $ 541 10,544 5,090 6,481 4,063 11,537
December 31, 2014
Credit default swaps on:
Corporate bonds $ 23 6,344 2,904 4,894 1,450 2,831 2015 - 2021
Structured products 654 1,055 874 608 447 277 2017 - 2052
Credit protection on:
Default swap index — 1,659 292 777 882 1,042 2015 - 2019
Commercial mortgage-backed securities index 246 1,058 — 608 450 355 2047 - 2063
Asset-backed securities index 19 52 1 1 51 81 2045 - 2046
Other 1 2,136 2,136 — 2,136 5,185 2015 - 2025
Total credit derivatives $ 943 12,304 6,207 6,888 5,416 9,771
Protection sold represents the estimated maximum
exposure to loss that would be incurred under an assumed
hypothetical circumstance, where the value of our interests and
any associated collateral declines to zero, without any
consideration of recovery or offset from any economic hedges.
We believe this hypothetical circumstance to be an extremely
remote possibility and accordingly, this required disclosure is
not an indication of expected loss. The amounts under non-
investment grade represent the notional amounts of those credit
derivatives on which we have a higher risk of being required to
perform under the terms of the credit derivative and are a
function of the underlying assets.
We consider the risk of performance to be high if the
underlying assets under the credit derivative have an external
rating that is below investment grade or an internal credit
default grade that is equivalent thereto. We believe the net
protection sold, which is representative of the net notional
amount of protection sold and purchased with identical
underlyings, in combination with other protection purchased, is
more representative of our exposure to loss than either non-
investment grade or protection sold. Other protection purchased
represents additional protection, which may offset the exposure
to loss for protection sold, that was not purchased with an
identical underlying of the protection sold.
Wells Fargo & Company
214