Wells Fargo 2015 Annual Report Download - page 198
Download and view the complete annual report
Please find page 198 of the 2015 Wells Fargo annual report below. You can navigate through the pages in the report by either clicking on the pages listed below, or by using the keyword search tool below to find specific information within the annual report.-
 1
1 -
2
-
3
-
4
-
5
-
6
-
7
-
8
-
9
-
10
-
11
-
12
-
13
-
14
-
15
-
16
-
17
-
18
-
19
-
20
-
21
-
22
-
23
-
24
-
25
-
26
-
27
-
28
-
29
-
30
-
31
-
32
-
33
-
34
-
35
-
36
-
37
-
38
-
39
-
40
-
41
-
42
-
43
-
44
-
45
-
46
-
47
-
48
-
49
-
50
-
51
-
52
-
53
-
54
-
55
-
56
-
57
-
58
-
59
-
60
-
61
-
62
-
63
-
64
-
65
-
66
-
67
-
68
-
69
-
70
-
71
-
72
-
73
-
74
-
75
-
76
-
77
-
78
-
79
-
80
-
81
-
82
-
83
-
84
-
85
-
86
-
87
-
88
-
89
-
90
-
91
-
92
-
93
-
94
-
95
-
96
-
97
-
98
-
99
-
100
-
101
-
102
-
103
-
104
-
105
-
106
-
107
-
108
-
109
-
110
-
111
-
112
-
113
-
114
-
115
-
116
-
117
-
118
-
119
-
120
-
121
-
122
-
123
-
124
-
125
-
126
-
127
-
128
-
129
-
130
-
131
-
132
-
133
-
134
-
135
-
136
-
137
-
138
-
139
-
140
-
141
-
142
-
143
-
144
-
145
-
146
-
147
-
148
-
149
-
150
-
151
-
152
-
153
-
154
-
155
-
156
-
157
-
158
-
159
-
160
-
161
-
162
-
163
-
164
-
165
-
166
-
167
-
168
-
169
-
170
-
171
-
172
-
173
-
174
-
175
-
176
-
177
-
178
-
179
-
180
-
181
-
182
-
183
-
184
-
185
-
186
-
187
-
 188
188 -
 189
189 -
 190
190 -
 191
191 -
 192
192 -
 193
193 -
 194
194 -
 195
195 -
 196
196 -
 197
197 -
 198
198 -
 199
199 -
 200
200 -
 201
201 -
 202
202 -
 203
203 -
 204
204 -
 205
205 -
 206
206 -
 207
207 -
 208
208 -
209
-
210
-
211
-
212
-
213
-
214
-
215
-
216
-
217
-
218
-
219
-
220
-
221
-
222
-
223
-
224
-
225
-
226
-
227
-
228
-
229
-
230
-
231
-
232
-
233
-
234
-
235
-
236
-
237
-
238
-
239
-
240
-
241
-
242
-
243
-
244
-
245
-
246
-
247
-
248
-
249
-
250
-
251
-
252
-
253
-
254
-
255
-
256
-
257
-
258
-
259
-
260
-
261
-
262
-
263
-
264
-
265
-
266
-
267
-
268
-
269
-
270
-
271
-
272
-
273
 |
 |

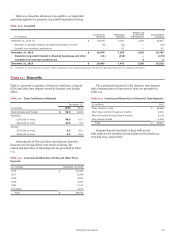
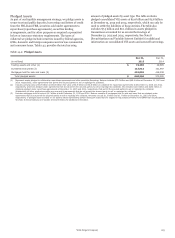
Note 10: Intangible Assets
Table 10.1 presents the gross carrying value of intangible assets
and accumulated amortization.
Table 10.1: Intangible Assets
December 31, 2015 December 31, 2014
Gross Net Gross
carrying Accumulated carrying carrying Accumulated Net carrying
(in millions) value amortization value value amortization value
Amortized intangible assets (1):
MSRs (2) $ 3,228 (1,920) 1,308 2,906 (1,664) 1,242
Core deposit intangibles 12,834 (10,295) 2,539 12,834 (9,273) 3,561
Customer relationship and other intangibles 3,163 (2,549) 614 3,179 (2,322) 857
Total amortized intangible assets $ 19,225 (14,764) 4,461 18,919 (13,259) 5,660
Unamortized intangible assets:
MSRs (carried at fair value) (2) $ 12,415 12,738
Goodwill 25,529 25,705
Trademark 14 14
(1) Excludes fully amortized intangible assets.
(2) See Note 9 (Mortgage Banking Activities) for additional information on MSRs.
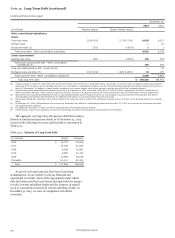
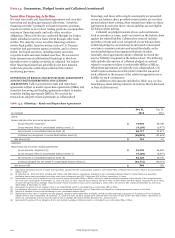
Table 10.2 provides the current year and estimated future asset balances at December 31, 2015. Future amortization
amortization expense for amortized intangible assets. We based expense may vary from these projections.
our projections of amortization expense shown below on existing
Table 10.2: Amortization Expense for Intangible Assets
Customer
relationship and
Core deposit other
(in millions) Amortized MSRs intangibles intangibles Total
Year ended December 31, 2015 (actual) $ 258 1,022 227 1,507
Estimate for year ended December 31,
2016 $ 259 919 208 1,386
2017 206 851 193 1,250
2018 170 769 185 1,124
2019 148 — 10 158
2020 135 — 6 141
For our goodwill impairment analysis, we allocate all of the
goodwill to the individual operating segments. We identify
reporting units that are one level below an operating segment
(referred to as a component), and distinguish these reporting
units based on how the segments and components are managed,
taking into consideration the economic characteristics, nature of
the products and customers of the components. At the time we
acquire a business, we allocate goodwill to applicable reporting
units based on their relative fair value, and if we have a
significant business reorganization, we may reallocate the
goodwill. See Note 24 (Operating Segments) for further
information on management reporting.
Wells Fargo & Company
196