Wells Fargo 2015 Annual Report Download - page 70
Download and view the complete annual report
Please find page 70 of the 2015 Wells Fargo annual report below. You can navigate through the pages in the report by either clicking on the pages listed below, or by using the keyword search tool below to find specific information within the annual report.-
 1
1 -
2
-
3
-
4
-
5
-
6
-
7
-
8
-
9
-
10
-
11
-
12
-
13
-
14
-
15
-
16
-
17
-
18
-
19
-
20
-
21
-
22
-
23
-
24
-
25
-
26
-
27
-
28
-
29
-
30
-
31
-
32
-
33
-
34
-
35
-
36
-
37
-
38
-
39
-
40
-
41
-
42
-
43
-
44
-
45
-
46
-
47
-
48
-
49
-
50
-
51
-
52
-
53
-
54
-
55
-
56
-
57
-
58
-
59
-
 60
60 -
 61
61 -
 62
62 -
 63
63 -
 64
64 -
 65
65 -
 66
66 -
 67
67 -
 68
68 -
 69
69 -
 70
70 -
 71
71 -
 72
72 -
 73
73 -
 74
74 -
 75
75 -
 76
76 -
 77
77 -
 78
78 -
 79
79 -
 80
80 -
81
-
82
-
83
-
84
-
85
-
86
-
87
-
88
-
89
-
90
-
91
-
92
-
93
-
94
-
95
-
96
-
97
-
98
-
99
-
100
-
101
-
102
-
103
-
104
-
105
-
106
-
107
-
108
-
109
-
110
-
111
-
112
-
113
-
114
-
115
-
116
-
117
-
118
-
119
-
120
-
121
-
122
-
123
-
124
-
125
-
126
-
127
-
128
-
129
-
130
-
131
-
132
-
133
-
134
-
135
-
136
-
137
-
138
-
139
-
140
-
141
-
142
-
143
-
144
-
145
-
146
-
147
-
148
-
149
-
150
-
151
-
152
-
153
-
154
-
155
-
156
-
157
-
158
-
159
-
160
-
161
-
162
-
163
-
164
-
165
-
166
-
167
-
168
-
169
-
170
-
171
-
172
-
173
-
174
-
175
-
176
-
177
-
178
-
179
-
180
-
181
-
182
-
183
-
184
-
185
-
186
-
187
-
188
-
189
-
190
-
191
-
192
-
193
-
194
-
195
-
196
-
197
-
198
-
199
-
200
-
201
-
202
-
203
-
204
-
205
-
206
-
207
-
208
-
209
-
210
-
211
-
212
-
213
-
214
-
215
-
216
-
217
-
218
-
219
-
220
-
221
-
222
-
223
-
224
-
225
-
226
-
227
-
228
-
229
-
230
-
231
-
232
-
233
-
234
-
235
-
236
-
237
-
238
-
239
-
240
-
241
-
242
-
243
-
244
-
245
-
246
-
247
-
248
-
249
-
250
-
251
-
252
-
253
-
254
-
255
-
256
-
257
-
258
-
259
-
260
-
261
-
262
-
263
-
264
-
265
-
266
-
267
-
268
-
269
-
270
-
271
-
272
-
273
 |
 |
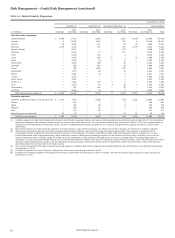
Risk Management – Credit Risk Management (continued)
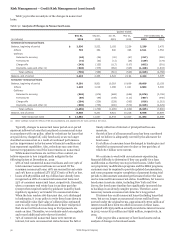
Table 21: Select Country Exposures
December 31, 2015
Lending (1) Securities (2) Derivatives and other (3) Total exposure
Non- Non- Non- Non-
(in millions) Sovereign sovereign Sovereign sovereign Sovereign sovereign Sovereign sovereign (4) Total
Top 20 country exposures:
United Kingdom $ 4,939 17,716 — 3,246 — 1,507 4,939 22,469 27,408
Canada 2 13,437 — 1,007 — 571 2 15,015 15,017
Ireland 22 3,190 — 210 — 88 22 3,488 3,510
Germany 1,279 1,340 — 474 — 330 1,279 2,144 3,423
Cayman Islands — 3,177 — — — 231 — 3,408 3,408
Bermuda — 2,840 — 77 — 101 — 3,018 3,018
India — 2,105 — 123 — 2 — 2,230 2,230
China — 1,907 — 181 70 1 70 2,089 2,159
Brazil — 2,143 — (2) — 5 — 2,146 2,146
Netherlands — 1,535 — 358 — 39 — 1,932 1,932
Australia — 938 — 922 — 38 — 1,898 1,898
France — 558 — 1,039 — 293 — 1,890 1,890
Switzerland — 1,755 — 48 — 10 — 1,813 1,813
Mexico — 1,482 — 43 — 2 — 1,527 1,527
Turkey — 1,479 — — — 1 — 1,480 1,480
South Korea — 1,367 — — — — — 1,367 1,367
Jersey, C.I. — 1,046 — 278 — 5 — 1,329 1,329
Chile — 1,270 — 20 4 32 4 1,322 1,326
Luxembourg — 807 — 202 — 42 — 1,051 1,051
Colombia — 1,004 — (2) — 4 — 1,006 1,006
Total top 20 country exposures $ 6,242 61,096 — 8,224 74 3,302 6,316 72,622 78,938
Eurozone exposure:
Eurozone countries included in Top 20 above (5) $ 1,301 7,430 — 2,283 — 792 1,301 10,505 11,806
Austria — 618 — 3 — 1 — 622 622
Spain — 324 — 46 — 8 — 378 378
Belgium — 245 — 23 — 1 — 269 269
Italy — 105 — 66 — — — 171 171
Other Eurozone countries (6) 21 26 — 4 — 10 21 40 61
Total Eurozone exposure $ 1,322 8,748 — 2,425 — 812 1,322 11,985 13,307
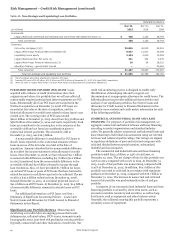
(1) Lending exposure includes funded loans and unfunded commitments, leveraged leases, and money market placements presented on a gross basis prior to the deduction of
impairment allowance and collateral received under the terms of the credit agreements. For the countries listed above, includes $37 million in PCI loans, predominantly to
customers in the Netherlands and Germany, and $1.2 billion in defeased leases secured primarily by U.S. Treasury and government agency securities, or government
guaranteed.
(2) Represents exposure on debt and equity securities of foreign issuers. Long and short positions are netted and net short positions are reflected as negative exposure.
(3) Represents counterparty exposure on foreign exchange and derivative contracts, and securities resale and lending agreements. This exposure is presented net of
counterparty netting adjustments and reduced by the amount of cash collateral. It includes credit default swaps (CDS) predominantly used to manage our U.S. and
London-based cash credit trading businesses, which sometimes results in selling and purchasing protection on the identical reference entity. Generally, we do not use
market instruments such as CDS to hedge the credit risk of our investment or loan positions, although we do use them to manage risk in our trading businesses. At
December 31, 2015, the gross notional amount of our CDS sold that reference assets in the Top 20 or Eurozone countries was $2.3 billion, which was offset by the notional
amount of CDS purchased of $2.3 billion. We did not have any CDS purchased or sold that reference pools of assets that contain sovereign debt or where the reference
asset was solely the sovereign debt of a foreign country.
(4) For countries presented in the table, total non-sovereign exposure comprises $36.3 billion exposure to financial institutions and $37.8 billion to non-financial corporations
at December 31, 2015.
(5) Consists of exposure to Ireland, Germany, Netherlands, France and Luxembourg included in Top 20.
(6) Includes non-sovereign exposure to Portugal in the amount of $28 million and less than $1 million to Greece. We had no sovereign debt exposure to these countries at
December 31, 2015.
Wells Fargo & Company
68