Wells Fargo 2015 Annual Report Download - page 94
Download and view the complete annual report
Please find page 94 of the 2015 Wells Fargo annual report below. You can navigate through the pages in the report by either clicking on the pages listed below, or by using the keyword search tool below to find specific information within the annual report.-
 1
1 -
2
-
3
-
4
-
5
-
6
-
7
-
8
-
9
-
10
-
11
-
12
-
13
-
14
-
15
-
16
-
17
-
18
-
19
-
20
-
21
-
22
-
23
-
24
-
25
-
26
-
27
-
28
-
29
-
30
-
31
-
32
-
33
-
34
-
35
-
36
-
37
-
38
-
39
-
40
-
41
-
42
-
43
-
44
-
45
-
46
-
47
-
48
-
49
-
50
-
51
-
52
-
53
-
54
-
55
-
56
-
57
-
58
-
59
-
60
-
61
-
62
-
63
-
64
-
65
-
66
-
67
-
68
-
69
-
70
-
71
-
72
-
73
-
74
-
75
-
76
-
77
-
78
-
79
-
80
-
81
-
82
-
83
-
 84
84 -
 85
85 -
 86
86 -
 87
87 -
 88
88 -
 89
89 -
 90
90 -
 91
91 -
 92
92 -
 93
93 -
 94
94 -
 95
95 -
 96
96 -
 97
97 -
 98
98 -
 99
99 -
 100
100 -
 101
101 -
 102
102 -
 103
103 -
 104
104 -
105
-
106
-
107
-
108
-
109
-
110
-
111
-
112
-
113
-
114
-
115
-
116
-
117
-
118
-
119
-
120
-
121
-
122
-
123
-
124
-
125
-
126
-
127
-
128
-
129
-
130
-
131
-
132
-
133
-
134
-
135
-
136
-
137
-
138
-
139
-
140
-
141
-
142
-
143
-
144
-
145
-
146
-
147
-
148
-
149
-
150
-
151
-
152
-
153
-
154
-
155
-
156
-
157
-
158
-
159
-
160
-
161
-
162
-
163
-
164
-
165
-
166
-
167
-
168
-
169
-
170
-
171
-
172
-
173
-
174
-
175
-
176
-
177
-
178
-
179
-
180
-
181
-
182
-
183
-
184
-
185
-
186
-
187
-
188
-
189
-
190
-
191
-
192
-
193
-
194
-
195
-
196
-
197
-
198
-
199
-
200
-
201
-
202
-
203
-
204
-
205
-
206
-
207
-
208
-
209
-
210
-
211
-
212
-
213
-
214
-
215
-
216
-
217
-
218
-
219
-
220
-
221
-
222
-
223
-
224
-
225
-
226
-
227
-
228
-
229
-
230
-
231
-
232
-
233
-
234
-
235
-
236
-
237
-
238
-
239
-
240
-
241
-
242
-
243
-
244
-
245
-
246
-
247
-
248
-
249
-
250
-
251
-
252
-
253
-
254
-
255
-
256
-
257
-
258
-
259
-
260
-
261
-
262
-
263
-
264
-
265
-
266
-
267
-
268
-
269
-
270
-
271
-
272
-
273
 |
 |
Risk Management - Asset/Liability Management (continued)
Economic hedges and other Economic hedges in trading are not
designated in a hedge accounting relationship and exclude
economic hedging related to our asset/liability risk management
and substantially all mortgage banking risk management
activities. Economic hedging activities include the use of trading
securities to economically hedge risk exposures related to non-
trading activities or derivatives to hedge risk exposures related
to trading assets or trading liabilities. Economic hedges are
unrelated to our customer accommodation activities. Other
activities include financial assets held for investment purposes
that we elected to carry at fair value with changes in fair value
recorded to earnings in order to mitigate accounting
measurement mismatches or avoid embedded derivative
accounting complexities.
Proprietary trading Proprietary trading consists of security or
derivative positions executed for our own account based upon
market expectations or to benefit from price differences between
financial instruments and markets. Proprietary trading activity
has been substantially restricted by the Dodd-Frank Act
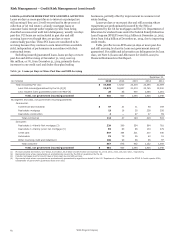
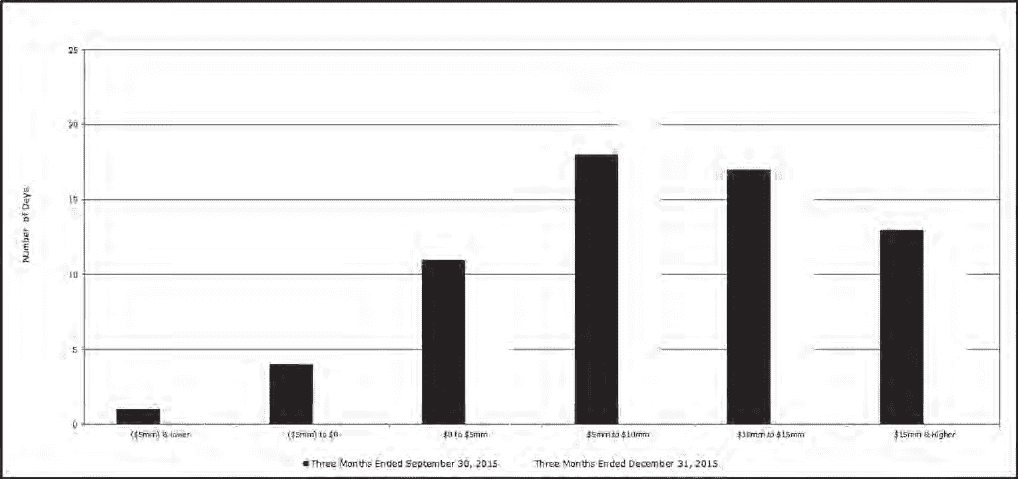
Table 42: Distribution of Daily Trading-Related Revenues
provisions known as the “Volcker Rule.” Accordingly, we
reduced and have exited certain business activities as a result of
the rule. As discussed within this section and the noninterest
income section of our financial results, proprietary trading
activity is insignificant to our business and financial results. For
more details on the Volcker Rule, see the “Regulatory Reform”
section in this Report.
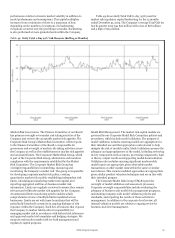
Daily Trading-Related Revenue Table 42 provides information
on the distribution of daily trading-related revenues for the
Company’s trading portfolio. This trading-related revenue is
defined as the change in value of the trading assets and trading
liabilities, trading-related net interest income, and trading-
related intra-day gains and losses. Net trading-related revenue
does not include activity related to long-term positions held for
economic hedging purposes, period-end adjustments, and other
activity not representative of daily price changes driven by
market factors.
Market risk is the risk of possible economic loss from adverse
changes in market risk factors such as interest rates, credit
spreads, foreign exchange rates, equity prices, commodity prices,
mortgage rates and mortgage liquidity. Market risk is intrinsic to
the Company’s sales and trading, market making, investing, and
risk management activities.
The Company uses Value-at-Risk (VaR) metrics
complemented with sensitivity analysis and stress testing in
measuring and monitoring market risk. These market risk
measures are monitored at both the business unit level and at
aggregated levels on a daily basis. Our corporate market risk
management function aggregates and monitors all exposures to
ensure risk measures are within our established risk appetite.
Changes to the market risk profile are analyzed and reported on
a daily basis. The Company monitors various market risk
exposure measures from a variety of perspectives, including line
of business, product, risk type, and legal entity.
Wells Fargo & Company
92