Wells Fargo 2015 Annual Report Download - page 77
Download and view the complete annual report
Please find page 77 of the 2015 Wells Fargo annual report below. You can navigate through the pages in the report by either clicking on the pages listed below, or by using the keyword search tool below to find specific information within the annual report.-
 1
1 -
2
-
3
-
4
-
5
-
6
-
7
-
8
-
9
-
10
-
11
-
12
-
13
-
14
-
15
-
16
-
17
-
18
-
19
-
20
-
21
-
22
-
23
-
24
-
25
-
26
-
27
-
28
-
29
-
30
-
31
-
32
-
33
-
34
-
35
-
36
-
37
-
38
-
39
-
40
-
41
-
42
-
43
-
44
-
45
-
46
-
47
-
48
-
49
-
50
-
51
-
52
-
53
-
54
-
55
-
56
-
57
-
58
-
59
-
60
-
61
-
62
-
63
-
64
-
65
-
66
-
 67
67 -
 68
68 -
 69
69 -
 70
70 -
 71
71 -
 72
72 -
 73
73 -
 74
74 -
 75
75 -
 76
76 -
 77
77 -
 78
78 -
 79
79 -
 80
80 -
 81
81 -
 82
82 -
 83
83 -
 84
84 -
 85
85 -
 86
86 -
 87
87 -
88
-
89
-
90
-
91
-
92
-
93
-
94
-
95
-
96
-
97
-
98
-
99
-
100
-
101
-
102
-
103
-
104
-
105
-
106
-
107
-
108
-
109
-
110
-
111
-
112
-
113
-
114
-
115
-
116
-
117
-
118
-
119
-
120
-
121
-
122
-
123
-
124
-
125
-
126
-
127
-
128
-
129
-
130
-
131
-
132
-
133
-
134
-
135
-
136
-
137
-
138
-
139
-
140
-
141
-
142
-
143
-
144
-
145
-
146
-
147
-
148
-
149
-
150
-
151
-
152
-
153
-
154
-
155
-
156
-
157
-
158
-
159
-
160
-
161
-
162
-
163
-
164
-
165
-
166
-
167
-
168
-
169
-
170
-
171
-
172
-
173
-
174
-
175
-
176
-
177
-
178
-
179
-
180
-
181
-
182
-
183
-
184
-
185
-
186
-
187
-
188
-
189
-
190
-
191
-
192
-
193
-
194
-
195
-
196
-
197
-
198
-
199
-
200
-
201
-
202
-
203
-
204
-
205
-
206
-
207
-
208
-
209
-
210
-
211
-
212
-
213
-
214
-
215
-
216
-
217
-
218
-
219
-
220
-
221
-
222
-
223
-
224
-
225
-
226
-
227
-
228
-
229
-
230
-
231
-
232
-
233
-
234
-
235
-
236
-
237
-
238
-
239
-
240
-
241
-
242
-
243
-
244
-
245
-
246
-
247
-
248
-
249
-
250
-
251
-
252
-
253
-
254
-
255
-
256
-
257
-
258
-
259
-
260
-
261
-
262
-
263
-
264
-
265
-
266
-
267
-
268
-
269
-
270
-
271
-
272
-
273
 |
 |

Our junior lien, as well as first lien, lines of credit products
generally have a draw period of 10 years (with some up to 15 or
20 years) with variable interest rate and payment options during
the draw period of (1) interest only or (2) 1.5% of outstanding
principal balance plus accrued interest. During the draw period,
the borrower has the option of converting all or a portion of the
line from a variable interest rate to a fixed rate with terms
including interest-only payments for a fixed period between
three to seven years or a fully amortizing payment with a fixed
period between five to 30 years. At the end of the draw period, a
line of credit generally converts to an amortizing payment
schedule with repayment terms of up to 30 years based on the
balance at time of conversion. Certain lines and loans have been
structured with a balloon payment, which requires full
repayment of the outstanding balance at the end of the term
period. The conversion of lines or loans to fully amortizing or
balloon payoff may result in a significant payment increase,
which can affect some borrowers’ ability to repay the
outstanding balance.
On a monthly basis, we monitor the payment characteristics
of borrowers in our junior lien portfolio. In December 2015,
approximately 47% of these borrowers paid only the minimum
amount due and approximately 48% paid more than the
minimum amount due. The rest were either delinquent or paid
less than the minimum amount due. For the borrowers with an
interest only payment feature, approximately 36% paid only the
minimum amount due and approximately 60% paid more than
the minimum amount due.
The lines that enter their amortization period may
experience higher delinquencies and higher loss rates than the
ones in their draw or term period. We have considered this
increased inherent risk in our allowance for credit loss estimate.
In anticipation of our borrowers reaching the end of their
contractual commitment, we have created a program to inform,
educate and help these borrowers transition from interest-only
to fully-amortizing payments or full repayment. We monitor the
performance of the borrowers moving through the program in
an effort to refine our ongoing program strategy.
Table 28 reflects the outstanding balance of our portfolio of
junior lien mortgages, including lines and loans, and senior lien
lines segregated into scheduled end of draw or end of term
periods and products that are currently amortizing, or in balloon
repayment status. It excludes real estate 1-4 family first lien line
reverse mortgages, which total $2.1 billion, because they are
predominantly insured by the FHA, and it excludes PCI loans,
which total $96 million, because their losses were generally
reflected in our nonaccretable difference established at the date
of acquisition.
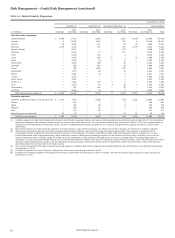
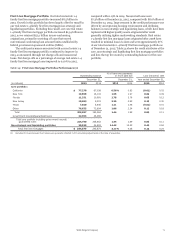
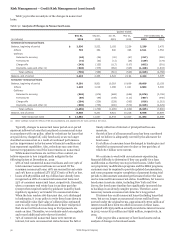
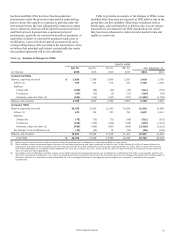
Table 28: Junior Lien Mortgage Line and Loan and Senior Lien Mortgage Line Portfolios Payment Schedule
Scheduled end of draw/term
Outstanding balance 2021 and
(in millions) December 31, 2015 2016 2017 2018 2019 2020 thereafter (1) Amortizing
Junior lien lines and loans $ 52,935 4,683 5,345 2,992 1,194 1,071 25,371 12,279
First lien lines 16,258 678 780 914 403 371 11,279 1,833
Total (2)(3) $ 69,193 5,361 6,125 3,906 1,597 1,442 36,650 14,112
% of portfolios 100% 8% 9% 6% 2% 2% 53% 20%
(1) Substantially all lines and loans are scheduled to convert to amortizing loans by the end of 2026, with annual scheduled amounts through that date ranging from
$2.8 billion to $8.9 billion and averaging $6.1 billion per year.
(2) Junior and first lien lines are predominantly interest-only during their draw period. The unfunded credit commitments for junior and first lien lines totaled $67.7 billion at
December 31, 2015.
(3) Includes scheduled end-of-term balloon payments for lines and loans totaling $237 million, $366 million, $423 million, $394 million, $429 million and $1.2 billion for 2016
2017, 2018, 2019, 2020, and 2021 and thereafter, respectively. Amortizing lines and loans include $191 million of end-of-term balloon payments, which are past due. At
December 31, 2015, $506 million, or 5% of outstanding lines of credit that are amortizing, are 30 or more days past due compared to $937 million or 2% for lines in their
draw period.
CREDIT CARDS Our credit card portfolio totaled $34.0 billion
at December 31, 2015, which represented 4% of our total
outstanding loans. The net charge-off rate for our credit card
portfolio was 3.00% for 2015, compared with 3.14% for 2014.
AUTOMOBILE Our automobile portfolio, predominantly
composed of indirect loans, totaled $60.0 billion at
December 31, 2015. The net charge-off rate for our automobile
portfolio was 0.72% for 2015, compared with 0.70% for 2014.
OTHER REVOLVING CREDIT AND INSTALLMENT Other
revolving credit and installment loans totaled $39.1 billion at
December 31, 2015, and primarily included student and security-
based loans. Student loans totaled $12.2 billion at December 31,
2015, compared with $11.9 billion at December 31, 2014. The net
charge-off rate for other revolving credit and installment loans
was 1.36% for 2015, compared with 1.35% for 2014.
Wells Fargo & Company
75