Wells Fargo 2015 Annual Report Download - page 225
Download and view the complete annual report
Please find page 225 of the 2015 Wells Fargo annual report below. You can navigate through the pages in the report by either clicking on the pages listed below, or by using the keyword search tool below to find specific information within the annual report.-
 1
1 -
2
-
3
-
4
-
5
-
6
-
7
-
8
-
9
-
10
-
11
-
12
-
13
-
14
-
15
-
16
-
17
-
18
-
19
-
20
-
21
-
22
-
23
-
24
-
25
-
26
-
27
-
28
-
29
-
30
-
31
-
32
-
33
-
34
-
35
-
36
-
37
-
38
-
39
-
40
-
41
-
42
-
43
-
44
-
45
-
46
-
47
-
48
-
49
-
50
-
51
-
52
-
53
-
54
-
55
-
56
-
57
-
58
-
59
-
60
-
61
-
62
-
63
-
64
-
65
-
66
-
67
-
68
-
69
-
70
-
71
-
72
-
73
-
74
-
75
-
76
-
77
-
78
-
79
-
80
-
81
-
82
-
83
-
84
-
85
-
86
-
87
-
88
-
89
-
90
-
91
-
92
-
93
-
94
-
95
-
96
-
97
-
98
-
99
-
100
-
101
-
102
-
103
-
104
-
105
-
106
-
107
-
108
-
109
-
110
-
111
-
112
-
113
-
114
-
115
-
116
-
117
-
118
-
119
-
120
-
121
-
122
-
123
-
124
-
125
-
126
-
127
-
128
-
129
-
130
-
131
-
132
-
133
-
134
-
135
-
136
-
137
-
138
-
139
-
140
-
141
-
142
-
143
-
144
-
145
-
146
-
147
-
148
-
149
-
150
-
151
-
152
-
153
-
154
-
155
-
156
-
157
-
158
-
159
-
160
-
161
-
162
-
163
-
164
-
165
-
166
-
167
-
168
-
169
-
170
-
171
-
172
-
173
-
174
-
175
-
176
-
177
-
178
-
179
-
180
-
181
-
182
-
183
-
184
-
185
-
186
-
187
-
188
-
189
-
190
-
191
-
192
-
193
-
194
-
195
-
196
-
197
-
198
-
199
-
200
-
201
-
202
-
203
-
204
-
205
-
206
-
207
-
208
-
209
-
210
-
211
-
212
-
213
-
214
-
 215
215 -
 216
216 -
 217
217 -
 218
218 -
 219
219 -
 220
220 -
 221
221 -
 222
222 -
 223
223 -
 224
224 -
 225
225 -
 226
226 -
 227
227 -
 228
228 -
 229
229 -
 230
230 -
 231
231 -
 232
232 -
 233
233 -
 234
234 -
 235
235 -
236
-
237
-
238
-
239
-
240
-
241
-
242
-
243
-
244
-
245
-
246
-
247
-
248
-
249
-
250
-
251
-
252
-
253
-
254
-
255
-
256
-
257
-
258
-
259
-
260
-
261
-
262
-
263
-
264
-
265
-
266
-
267
-
268
-
269
-
270
-
271
-
272
-
273
 |
 |

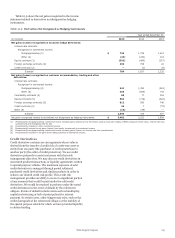
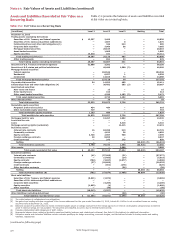
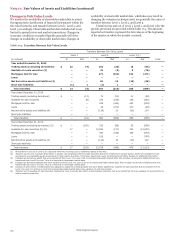
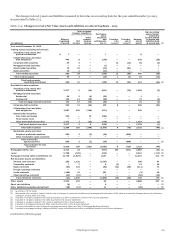
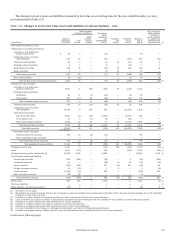
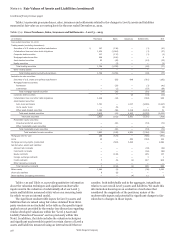
The changes in Level 3 assets and liabilities measured at fair value on a recurring basis for the year ended December 31, 2015,
are presented in Table 17.4.
Table 17.4: Changes in Level 3 Fair Value Assets and Liabilities on a Recurring Basis – 2015
Total net gains
(losses) included in
Other
Purchases,
sales,
issuances
Net unrealized
gains (losses)
included in
income related
(in millions)
Balance,
beginning
of period
Net
income
compre-
hensive
income
and
settlements,
net (1)
Transfers
into
Level 3
Transfers
out of
Level 3
Balance,
end of
period
to assets and
liabilities held
at period end (2)
Year ended December 31, 2015
Trading assets (excluding derivatives):
Securities of U.S. states and
political subdivisions $ 7 — — 1 — — 8 —
Collateralized loan and other
debt obligations 445 8 — (110) — — 343 (28)
Corporate debt securities 54 2 — — 12 (12) 56 (2)
Mortgage-backed securities — 1 — (1) — — — 1
Asset-backed securities 79 16 — (14) — (81) — —
Equity securities 10 1 — (11) — — — —
Total trading securities 595 28 — (135) 12 (93) 407 (29)
Other trading assets 55 3 — (24) 1 (1) 34 (14)
Total trading assets
(excluding derivatives) 650 31 — (159) 13 (94) 441 (43) (3)
Available-for-sale securities:
Securities of U.S. states and
political subdivisions 2,277 6 (16) (691) — (76) 1,500 (5)
Mortgage-backed securities:
Residential 24 5 (6) (22) — — 1 —
Commercial 109 12 (18) (30) — — 73 (2)
Total mortgage-backed securities 133 17 (24) (52) — — 74 (2)
Corporate debt securities 252 12 (46) 179 8 — 405 (32)
Collateralized loan and other
debt obligations 1,087 218 (169) (571) — — 565 —
Asset-backed securities:
Auto loans and leases 245 — 19 (264) — — — —
Home equity loans — — — — — — — —
Other asset-backed securities 1,372 2 (13) (179) — — 1,182 (1)
Total asset-backed securities 1,617 2 6 (443) — — 1,182 (1)
Total debt securities 5,366 255 (249) (1,578) 8 (76) 3,726 (40) (4)
Marketable equity securities:
Perpetual preferred securities 663 3 (2) (24) — (640) — —
Other marketable equity securities — — — — — — — —
Total marketable
equity securities 663 3 (2) (24) — (640) — — (5)
Total available-for-sale
securities 6,029 258 (251) (1,602) 8 (716) 3,726 (40)
Mortgages held for sale 2,313 23 — (977) 194 (471) 1,082 (23) (6)
Loans 5,788 (128) — (344) — — 5,316 (117) (6)
Mortgage servicing rights (residential) (7) 12,738 (1,870) — 1,547 — — 12,415 214 (6)
Net derivative assets and liabilities:
Interest rate contracts 293 1,132 — (1,137) — — 288 97
Commodity contracts 1 7 — 6 (2) — 12 10
Equity contracts (84) 116 — (82) (13) (48) (111) 74
Foreign exchange contracts — — — — — — — —
Credit contracts (189) 19 — 167 — — (3) 10
Other derivative contracts (44) (15) — 1 — — (58) (15)
Total derivative contracts (23) 1,259 — (1,045) (15) (48) 128 176 (8)
Other assets 2,593 443 — 52 — — 3,088 457 (3)
Short sale liabilities (6) — — 6 — — — — (3)
Other liabilities (excluding derivatives) (28) (13) — 11 — — (30) — (6)
(1) See Table 17.5 for detail.
(2) Represents only net gains (losses) that are due to changes in economic conditions and management’s estimates of fair value and excludes changes due to the collection/
realization of cash flows over time.
(3) Included in net gains (losses) from trading activities and other noninterest income in the income statement.
(4) Included in net gains (losses) from debt securities in the income statement.
(5) Included in net gains (losses) from equity investments in the income statement.
(6) Included in mortgage banking and other noninterest income in the income statement.
(7) For more information on the changes in mortgage servicing rights, see Note 9 (Mortgage Banking Activities).
(8) Included in mortgage banking, trading activities, equity investments and other noninterest income in the income statement.
(continued on following page)
Wells Fargo & Company
223