Wells Fargo 2015 Annual Report Download - page 39
Download and view the complete annual report
Please find page 39 of the 2015 Wells Fargo annual report below. You can navigate through the pages in the report by either clicking on the pages listed below, or by using the keyword search tool below to find specific information within the annual report.-
 1
1 -
2
-
3
-
4
-
5
-
6
-
7
-
8
-
9
-
10
-
11
-
12
-
13
-
14
-
15
-
16
-
17
-
18
-
19
-
20
-
21
-
22
-
23
-
24
-
25
-
26
-
27
-
28
-
 29
29 -
 30
30 -
 31
31 -
 32
32 -
 33
33 -
 34
34 -
 35
35 -
 36
36 -
 37
37 -
 38
38 -
 39
39 -
 40
40 -
 41
41 -
 42
42 -
 43
43 -
 44
44 -
 45
45 -
 46
46 -
 47
47 -
 48
48 -
 49
49 -
50
-
51
-
52
-
53
-
54
-
55
-
56
-
57
-
58
-
59
-
60
-
61
-
62
-
63
-
64
-
65
-
66
-
67
-
68
-
69
-
70
-
71
-
72
-
73
-
74
-
75
-
76
-
77
-
78
-
79
-
80
-
81
-
82
-
83
-
84
-
85
-
86
-
87
-
88
-
89
-
90
-
91
-
92
-
93
-
94
-
95
-
96
-
97
-
98
-
99
-
100
-
101
-
102
-
103
-
104
-
105
-
106
-
107
-
108
-
109
-
110
-
111
-
112
-
113
-
114
-
115
-
116
-
117
-
118
-
119
-
120
-
121
-
122
-
123
-
124
-
125
-
126
-
127
-
128
-
129
-
130
-
131
-
132
-
133
-
134
-
135
-
136
-
137
-
138
-
139
-
140
-
141
-
142
-
143
-
144
-
145
-
146
-
147
-
148
-
149
-
150
-
151
-
152
-
153
-
154
-
155
-
156
-
157
-
158
-
159
-
160
-
161
-
162
-
163
-
164
-
165
-
166
-
167
-
168
-
169
-
170
-
171
-
172
-
173
-
174
-
175
-
176
-
177
-
178
-
179
-
180
-
181
-
182
-
183
-
184
-
185
-
186
-
187
-
188
-
189
-
190
-
191
-
192
-
193
-
194
-
195
-
196
-
197
-
198
-
199
-
200
-
201
-
202
-
203
-
204
-
205
-
206
-
207
-
208
-
209
-
210
-
211
-
212
-
213
-
214
-
215
-
216
-
217
-
218
-
219
-
220
-
221
-
222
-
223
-
224
-
225
-
226
-
227
-
228
-
229
-
230
-
231
-
232
-
233
-
234
-
235
-
236
-
237
-
238
-
239
-
240
-
241
-
242
-
243
-
244
-
245
-
246
-
247
-
248
-
249
-
250
-
251
-
252
-
253
-
254
-
255
-
256
-
257
-
258
-
259
-
260
-
261
-
262
-
263
-
264
-
265
-
266
-
267
-
268
-
269
-
270
-
271
-
272
-
273
 |
 |

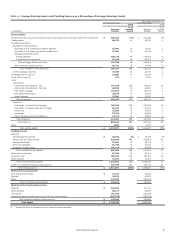
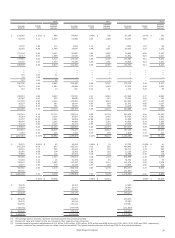
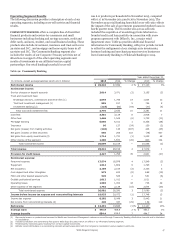
Table 4: Average Earning Assets and Funding Sources as a Percentage of Average Earnings Assets
Year ended December 31,
2015 2014
% of % of
(in millions)
Average
balance
earning
assets
Average
balance
earning
assets
Earning assets
Federal funds sold, securities purchased under resale agreements and other short-term investments $ 266,832 17% $ 241,282 17%
Trading assets 66,679 4 55,140 4
Investment securities:
Available-for-sale securities:
Securities of U.S. Treasury and federal agencies 32,093 2 10,400 1
Securities of U.S. states and political subdivisions 47,404 3 43,138 3
Mortgage-backed securities:
Federal agencies 100,218 6 114,076 8
Residential and commercial 22,490 2 26,475 2
Total mortgage-backed securities 122,708 8 140,551 10
Other debt and equity securities 49,752 3 47,488 3
Total available-for-sale securities 251,957 16 241,577 17
Held-to-maturity securities 74,048 5 29,319 2
Mortgages held for sale (1) 21,603 2 19,018 2
Loans held for sale (1) 573 — 4,226 —
Loans:
Commercial:
Commercial and industrial - U.S. 237,844 15 204,819 14
Commercial and industrial - Non U.S. 46,028 3 42,661 3
Real estate mortgage 116,893 7 112,710 8
Real estate construction 20,979 1 17,676 1
Lease financing 12,301 1 12,257 1
Total commercial 434,045 27 390,123 27
Consumer:
Real estate 1-4 family first mortgage 268,560 17 261,620 18
Real estate 1-4 family junior lien mortgage 56,242 4 62,510 4
Credit card 31,307 2 27,491 2
Automobile 57,766 4 53,854 4
Other revolving credit and installment 37,512 2 38,834 3
Total consumer 451,387 29 444,309 31
Total loans (1)
Other
$
885,432
4,947
1,572,071
56
—
100% $
834,432
4,673
1,429,667
58
—
100%Total earning assets
Funding sources
Deposits:
Interest-bearing checking $ 38,640 2% $ 39,729 3%
Market rate and other savings 625,549 40 585,854 41
Savings certificates 31,887 2 38,111 3
Other time deposits 51,790 3 51,434 3
Deposits in foreign offices 107,138 7 95,889 7
Total interest-bearing deposits 855,004 54 811,017 57
Short-term borrowings 87,465 6 60,111 4
Long-term debt 185,078 12 167,420 12
Other liabilities 16,545 1 14,401 1
Total interest-bearing liabilities
Portion of noninterest-bearing funding sources
1,144,092
427,979
73
27
1,052,949
376,718
74
26
Total funding sources $ 1,572,071 100% $ 1,429,667 100%
Noninterest-earning assets
Cash and due from banks $ 17,327 16,361
Goodwill 25,673 25,687
Other 127,848 121,634
Total noninterest-earning assets $ 170,848 163,682
Noninterest-bearing funding sources
Deposits $ 339,069 303,127
Other liabilities 68,174 56,985
Total equity 191,584 180,288
Noninterest-bearing funding sources used to fund earning assets (427,979) (376,718)
Net noninterest-bearing funding sources $ 170,848 163,682
Total assets $ 1,742,919 1,593,349
(1) Nonaccrual loans are included in their respective loan categories.
Wells Fargo & Company
37