Wells Fargo 2015 Annual Report Download - page 86
Download and view the complete annual report
Please find page 86 of the 2015 Wells Fargo annual report below. You can navigate through the pages in the report by either clicking on the pages listed below, or by using the keyword search tool below to find specific information within the annual report.-
 1
1 -
2
-
3
-
4
-
5
-
6
-
7
-
8
-
9
-
10
-
11
-
12
-
13
-
14
-
15
-
16
-
17
-
18
-
19
-
20
-
21
-
22
-
23
-
24
-
25
-
26
-
27
-
28
-
29
-
30
-
31
-
32
-
33
-
34
-
35
-
36
-
37
-
38
-
39
-
40
-
41
-
42
-
43
-
44
-
45
-
46
-
47
-
48
-
49
-
50
-
51
-
52
-
53
-
54
-
55
-
56
-
57
-
58
-
59
-
60
-
61
-
62
-
63
-
64
-
65
-
66
-
67
-
68
-
69
-
70
-
71
-
72
-
73
-
74
-
75
-
 76
76 -
 77
77 -
 78
78 -
 79
79 -
 80
80 -
 81
81 -
 82
82 -
 83
83 -
 84
84 -
 85
85 -
 86
86 -
 87
87 -
 88
88 -
 89
89 -
 90
90 -
 91
91 -
 92
92 -
 93
93 -
 94
94 -
 95
95 -
 96
96 -
97
-
98
-
99
-
100
-
101
-
102
-
103
-
104
-
105
-
106
-
107
-
108
-
109
-
110
-
111
-
112
-
113
-
114
-
115
-
116
-
117
-
118
-
119
-
120
-
121
-
122
-
123
-
124
-
125
-
126
-
127
-
128
-
129
-
130
-
131
-
132
-
133
-
134
-
135
-
136
-
137
-
138
-
139
-
140
-
141
-
142
-
143
-
144
-
145
-
146
-
147
-
148
-
149
-
150
-
151
-
152
-
153
-
154
-
155
-
156
-
157
-
158
-
159
-
160
-
161
-
162
-
163
-
164
-
165
-
166
-
167
-
168
-
169
-
170
-
171
-
172
-
173
-
174
-
175
-
176
-
177
-
178
-
179
-
180
-
181
-
182
-
183
-
184
-
185
-
186
-
187
-
188
-
189
-
190
-
191
-
192
-
193
-
194
-
195
-
196
-
197
-
198
-
199
-
200
-
201
-
202
-
203
-
204
-
205
-
206
-
207
-
208
-
209
-
210
-
211
-
212
-
213
-
214
-
215
-
216
-
217
-
218
-
219
-
220
-
221
-
222
-
223
-
224
-
225
-
226
-
227
-
228
-
229
-
230
-
231
-
232
-
233
-
234
-
235
-
236
-
237
-
238
-
239
-
240
-
241
-
242
-
243
-
244
-
245
-
246
-
247
-
248
-
249
-
250
-
251
-
252
-
253
-
254
-
255
-
256
-
257
-
258
-
259
-
260
-
261
-
262
-
263
-
264
-
265
-
266
-
267
-
268
-
269
-
270
-
271
-
272
-
273
 |
 |

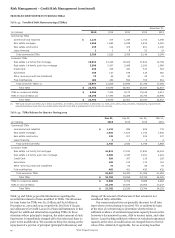
Risk Management – Credit Risk Management (continued)
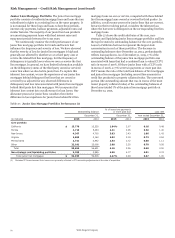
ALLOWANCE FOR CREDIT LOSSES The allowance for credit
losses, which consists of the allowance for loan losses and the
allowance for unfunded credit commitments, is management’s
estimate of credit losses inherent in the loan portfolio and
unfunded credit commitments at the balance sheet date,
excluding loans carried at fair value. The detail of the changes in
the allowance for credit losses by portfolio segment (including
charge-offs and recoveries by loan class) is in Note 6 (Loans and
Allowance for Credit Losses) to Financial Statements in this
Report.
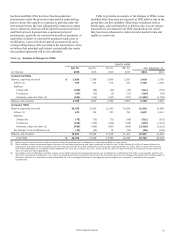
We apply a disciplined process and methodology to
establish our allowance for credit losses each quarter. This
process takes into consideration many factors, including
historical and forecasted loss trends, loan-level credit quality
ratings and loan grade-specific characteristics. The process
involves subjective and complex judgments. In addition, we
review a variety of credit metrics and trends. These credit
metrics and trends, however, do not solely determine the
amount of the allowance as we use several analytical tools. Our
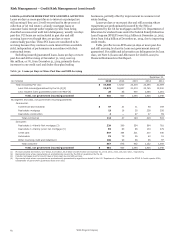
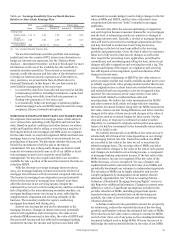
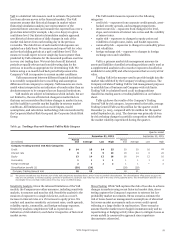
Table 38: Allocation of the Allowance for Credit Losses (ACL)
estimation approach for the commercial portfolio reflects the
estimated probability of default in accordance with the
borrower's financial strength, and the severity of loss in the
event of default, considering the quality of any underlying
collateral. Probability of default and severity at the time of
default are statistically derived through historical observations of
defaults and losses after default within each credit risk rating.
Our estimation approach for the consumer portfolio uses
forecasted losses that represent our best estimate of inherent
loss based on historical experience, quantitative and other
mathematical techniques over the loss emergence period. For
additional information on our allowance for credit losses, see the
“Critical Accounting Policies – Allowance for Credit Losses”
section and Note 1 (Summary of Significant Accounting Policies)
and Note 6 (Loans and Allowance for Credit Losses) to Financial
Statements in this Report.
Table 38 presents the allocation of the allowance for credit
losses by loan segment and class for the last five years.
Dec 31, 2015 Dec 31, 2014 Dec 31, 2013 Dec 31, 2012 Dec 31, 2011
Loans Loans Loans Loans Loans
as % as % as % as % as %
of total of total of total of total of total
(in millions) ACL loans ACL loans ACL loans ACL loans ACL loans
Commercial:
Commercial and industrial $ 4,231 33% $ 3,506 32% $ 3,040 29% $ 2,789 28% $ 2,810 27%
Real estate mortgage 1,264 13 1,576 13 2,157 14 2,284 13 2,570 14
Real estate construction 1,210 3 1,097 2 775 2 552 2 893 2
Lease financing 167 1 198 1 131 1 89 2 85 2
Total commercial 6,872 50 6,377 48 6,103 46 5,714 45 6,358 45
Consumer:
Real estate 1-4 family first mortgage 1,895 30 2,878 31 4,087 32 6,100 31 6,934 30
Real estate 1-4 family junior lien
mortgage 1,223 6 1,566 7 2,534 8 3,462 10 3,897 11
Credit card 1,412 4 1,271 4 1,224 3 1,234 3 1,294 3
Automobile 529 6 516 6 475 6 417 6 555 6
Other revolving credit and
installment 581 4 561 4 548 5 550 5 630 5
Total consumer 5,640 50 6,792 52 8,868 54 11,763 55 13,310 55
Total $ 12,512 100% $ 13,169 100% $ 14,971 100% $ 17,477 100% $ 19,668 100%
Dec 31, 2015 Dec 31, 2014 Dec 31, 2013 Dec 31, 2012 Dec 31, 2011
Components:
Allowance for loan losses $ 11,545 12,319 14,502 17,060 19,372
Allowance for unfunded credit
commitments 967 850 469 417 296
Allowance for credit losses $ 12,512 13,169 14,971 17,477 19,668
Allowance for loan losses as a
percentage of total loans 1.26% 1.43 1.76 2.13 2.52
Allowance for loan losses as a
percentage of total net charge-offs 399 418 322 189 171
Allowance for credit losses as a
percentage of total loans 1.37 1.53 1.82 2.19 2.56
Allowance for credit losses as a
percentage of total nonaccrual loans 110 103 96 85 92
Wells Fargo & Company
84