Wells Fargo 2015 Annual Report Download - page 162
Download and view the complete annual report
Please find page 162 of the 2015 Wells Fargo annual report below. You can navigate through the pages in the report by either clicking on the pages listed below, or by using the keyword search tool below to find specific information within the annual report.-
 1
1 -
 2
2 -
 3
3 -
 4
4 -
 5
5 -
 6
6 -
 7
7 -
 8
8 -
 9
9 -
 10
10 -
 11
11 -
 12
12 -
 13
13 -
 14
14 -
 15
15 -
 16
16 -
 17
17 -
 18
18 -
 19
19 -
 20
20 -
 21
21 -
 22
22 -
 23
23 -
 24
24 -
 25
25 -
 26
26 -
 27
27 -
 28
28 -
 29
29 -
 30
30 -
 31
31 -
 32
32 -
 33
33 -
 34
34 -
 35
35 -
 36
36 -
 37
37 -
 38
38 -
 39
39 -
 40
40 -
 41
41 -
 42
42 -
 43
43 -
 44
44 -
 45
45 -
 46
46 -
 47
47 -
 48
48 -
 49
49 -
 50
50 -
 51
51 -
 52
52 -
 53
53 -
 54
54 -
 55
55 -
 56
56 -
 57
57 -
 58
58 -
 59
59 -
 60
60 -
 61
61 -
 62
62 -
 63
63 -
 64
64 -
 65
65 -
 66
66 -
 67
67 -
 68
68 -
 69
69 -
 70
70 -
 71
71 -
 72
72 -
 73
73 -
 74
74 -
 75
75 -
 76
76 -
 77
77 -
 78
78 -
 79
79 -
 80
80 -
 81
81 -
 82
82 -
 83
83 -
 84
84 -
 85
85 -
 86
86 -
 87
87 -
 88
88 -
 89
89 -
 90
90 -
 91
91 -
 92
92 -
 93
93 -
 94
94 -
 95
95 -
 96
96 -
 97
97 -
 98
98 -
 99
99 -
 100
100 -
 101
101 -
 102
102 -
 103
103 -
 104
104 -
 105
105 -
 106
106 -
 107
107 -
 108
108 -
 109
109 -
 110
110 -
 111
111 -
 112
112 -
 113
113 -
 114
114 -
 115
115 -
 116
116 -
 117
117 -
 118
118 -
 119
119 -
 120
120 -
 121
121 -
 122
122 -
 123
123 -
 124
124 -
 125
125 -
 126
126 -
 127
127 -
 128
128 -
 129
129 -
 130
130 -
 131
131 -
 132
132 -
 133
133 -
 134
134 -
 135
135 -
 136
136 -
 137
137 -
 138
138 -
 139
139 -
 140
140 -
 141
141 -
 142
142 -
 143
143 -
 144
144 -
 145
145 -
 146
146 -
 147
147 -
 148
148 -
 149
149 -
 150
150 -
 151
151 -
 152
152 -
 153
153 -
 154
154 -
 155
155 -
 156
156 -
 157
157 -
 158
158 -
 159
159 -
 160
160 -
 161
161 -
 162
162 -
 163
163 -
 164
164 -
 165
165 -
 166
166 -
 167
167 -
 168
168 -
 169
169 -
 170
170 -
 171
171 -
 172
172 -
 173
173 -
 174
174 -
 175
175 -
 176
176 -
 177
177 -
 178
178 -
 179
179 -
 180
180 -
 181
181 -
 182
182 -
 183
183 -
 184
184 -
 185
185 -
 186
186 -
 187
187 -
 188
188 -
 189
189 -
 190
190 -
 191
191 -
 192
192 -
 193
193 -
 194
194 -
 195
195 -
 196
196 -
 197
197 -
 198
198 -
 199
199 -
 200
200 -
 201
201 -
 202
202 -
 203
203 -
 204
204 -
 205
205 -
 206
206 -
 207
207 -
 208
208 -
 209
209 -
 210
210 -
 211
211 -
 212
212 -
 213
213 -
 214
214 -
 215
215 -
 216
216 -
 217
217 -
 218
218 -
 219
219 -
 220
220 -
 221
221 -
 222
222 -
 223
223 -
 224
224 -
 225
225 -
 226
226 -
 227
227 -
 228
228 -
 229
229 -
 230
230 -
 231
231 -
 232
232 -
 233
233 -
 234
234 -
 235
235 -
 236
236 -
 237
237 -
 238
238 -
 239
239 -
 240
240 -
 241
241 -
 242
242 -
 243
243 -
 244
244 -
 245
245 -
 246
246 -
 247
247 -
 248
248 -
 249
249 -
 250
250 -
 251
251 -
 252
252 -
 253
253 -
 254
254 -
 255
255 -
 256
256 -
 257
257 -
 258
258 -
 259
259 -
 260
260 -
 261
261 -
 262
262 -
 263
263 -
 264
264 -
 265
265 -
 266
266 -
 267
267 -
 268
268 -
 269
269 -
 270
270 -
 271
271 -
 272
272 -
 273
273
 |
 |

Note 5: Investment Securities (continued)
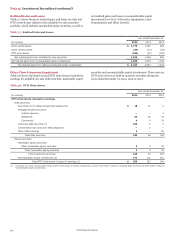
Realized Gains and Losses net realized gains and losses on nonmarketable equity
Table 5.7 shows the gross realized gains and losses on sales and investments (see Note 7 (Premises, Equipment, Lease
OTTI write-downs related to the available-for-sale securities Commitments and Other Assets)).
portfolio, which includes marketable equity securities, as well as
Table 5.7: Realized Gains and Losses
Year ended December 31,
(in millions) 2015 2014 2013
Gross realized gains $ 1,775 1,560 492
Gross realized losses (67) (14) (24)
OTTI write-downs (185) (52) (183)
Net realized gains from available-for-sale securities 1,523 1,494 285
Net realized gains from nonmarketable equity investments 1,659 1,479 1,158
Net realized gains from debt securities and equity investments $ 3,182 2,973 1,443
Other-Than-Temporary Impairment securities and nonmarketable equity investments. There were no
Table 5.8 shows the detail of total OTTI write-downs included in OTTI write-downs on held-to-maturity securities during the
earnings for available-for-sale debt securities, marketable equity years ended December 31, 2015, 2014 or 2013.
Table 5.8: OTTI Write-downs
Year ended December 31,
(in millions) 2015 2014 2013
OTTI write-downs included in earnings
Debt securities:
Securities of U.S. states and political subdivisions $ 18 11 2
Mortgage-backed securities:
Federal agencies — — 1
Residential 54 26 72
Commercial 4 9 53
Corporate debt securities (1) 105 1 4
Collateralized loan and other debt obligations — 2 —
Other debt securities 2 — 26
Total debt securities 183 49 158
Equity securities:
Marketable equity securities:
Other marketable equity securities 2 3 25
Total marketable equity securities 2 3 25
Total investment securities 185 52 183
Nonmarketable equity investments (1) 374 270 161
Total OTTI write-downs included in earnings (1) $ 559 322 344
(1) December 31, 2015, includes $287 million in OTTI write-downs of energy investments, of which $104 million related to corporate debt securities and $183 million related to
nonmarketable equity investments.
Wells Fargo & Company
160
