Wells Fargo 2015 Annual Report Download - page 197
Download and view the complete annual report
Please find page 197 of the 2015 Wells Fargo annual report below. You can navigate through the pages in the report by either clicking on the pages listed below, or by using the keyword search tool below to find specific information within the annual report.-
 1
1 -
2
-
3
-
4
-
5
-
6
-
7
-
8
-
9
-
10
-
11
-
12
-
13
-
14
-
15
-
16
-
17
-
18
-
19
-
20
-
21
-
22
-
23
-
24
-
25
-
26
-
27
-
28
-
29
-
30
-
31
-
32
-
33
-
34
-
35
-
36
-
37
-
38
-
39
-
40
-
41
-
42
-
43
-
44
-
45
-
46
-
47
-
48
-
49
-
50
-
51
-
52
-
53
-
54
-
55
-
56
-
57
-
58
-
59
-
60
-
61
-
62
-
63
-
64
-
65
-
66
-
67
-
68
-
69
-
70
-
71
-
72
-
73
-
74
-
75
-
76
-
77
-
78
-
79
-
80
-
81
-
82
-
83
-
84
-
85
-
86
-
87
-
88
-
89
-
90
-
91
-
92
-
93
-
94
-
95
-
96
-
97
-
98
-
99
-
100
-
101
-
102
-
103
-
104
-
105
-
106
-
107
-
108
-
109
-
110
-
111
-
112
-
113
-
114
-
115
-
116
-
117
-
118
-
119
-
120
-
121
-
122
-
123
-
124
-
125
-
126
-
127
-
128
-
129
-
130
-
131
-
132
-
133
-
134
-
135
-
136
-
137
-
138
-
139
-
140
-
141
-
142
-
143
-
144
-
145
-
146
-
147
-
148
-
149
-
150
-
151
-
152
-
153
-
154
-
155
-
156
-
157
-
158
-
159
-
160
-
161
-
162
-
163
-
164
-
165
-
166
-
167
-
168
-
169
-
170
-
171
-
172
-
173
-
174
-
175
-
176
-
177
-
178
-
179
-
180
-
181
-
182
-
183
-
184
-
185
-
186
-
 187
187 -
 188
188 -
 189
189 -
 190
190 -
 191
191 -
 192
192 -
 193
193 -
 194
194 -
 195
195 -
 196
196 -
 197
197 -
 198
198 -
 199
199 -
 200
200 -
 201
201 -
 202
202 -
 203
203 -
 204
204 -
 205
205 -
 206
206 -
 207
207 -
208
-
209
-
210
-
211
-
212
-
213
-
214
-
215
-
216
-
217
-
218
-
219
-
220
-
221
-
222
-
223
-
224
-
225
-
226
-
227
-
228
-
229
-
230
-
231
-
232
-
233
-
234
-
235
-
236
-
237
-
238
-
239
-
240
-
241
-
242
-
243
-
244
-
245
-
246
-
247
-
248
-
249
-
250
-
251
-
252
-
253
-
254
-
255
-
256
-
257
-
258
-
259
-
260
-
261
-
262
-
263
-
264
-
265
-
266
-
267
-
268
-
269
-
270
-
271
-
272
-
273
 |
 |

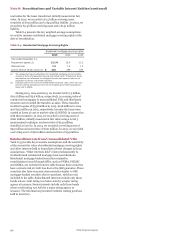
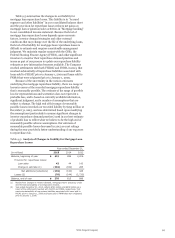
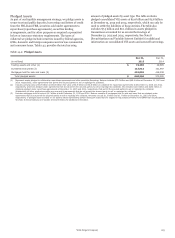
Table 9.5 summarizes the changes in our liability for
mortgage loan repurchase losses. This liability is in “Accrued
expenses and other liabilities” in our consolidated balance sheet
and the provision for repurchase losses reduces net gains on
mortgage loan origination/sales activities in "Mortgage banking"
in our consolidated income statement. Because the level of
mortgage loan repurchase losses depends upon economic
factors, investor demand strategies and other external
conditions that may change over the life of the underlying loans,
the level of the liability for mortgage loan repurchase losses is
difficult to estimate and requires considerable management
judgment. We maintain regular contact with the GSEs, the
Federal Housing Finance Agency (FHFA), and other significant
investors to monitor their repurchase demand practices and
issues as part of our process to update our repurchase liability
estimate as new information becomes available. The Company
reached settlements with both FHLMC and FNMA in 2013, that
resolved substantially all repurchase liabilities associated with
loans sold to FHLMC prior to January 1, 2009 and loans sold to
FNMA that were originated prior to January 1, 2009.
Because of the uncertainty in the various estimates
underlying the mortgage repurchase liability, there is a range of
losses in excess of the recorded mortgage repurchase liability
that is reasonably possible. The estimate of the range of possible
loss for representations and warranties does not represent a
probable loss, and is based on currently available information,
significant judgment, and a number of assumptions that are
subject to change. The high end of this range of reasonably
possible losses exceeded our recorded liability by $293 million at
December 31, 2015, and was determined based upon modifying
the assumptions (particularly to assume significant changes in
investor repurchase demand practices) used in our best estimate
of probable loss to reflect what we believe to be the high end of
reasonably possible adverse assumptions. Our estimate of
reasonably possible losses decreased in 2015 as court rulings
during the year provided a better understanding of our exposure
to repurchase risk.
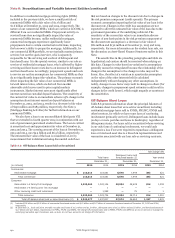
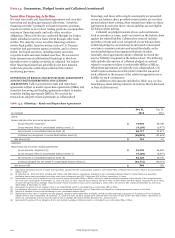
Table 9.5: Analysis of Changes in Liability for Mortgage Loan
Repurchase Losses
Year ended December 31,
(in millions) 2015 2014 2013
Balance, beginning of year $ 615 899 2,206
Provision for repurchase losses:
Loan sales 43 44 143
Change in estimate (1) (202) (184) 285
Net additions (reductions) (159) (140) 428
Losses (2) (78) (144) (1,735)
Balance, end of year $ 378 615 899
(1) Results from changes in investor demand, mortgage insurer practices, credit
and the financial stability of correspondent lenders.
(2) Year ended December 31, 2013, reflects $746 million and $508 million as a
result of the settlements reached with FHLMC and FNMA, respectively, that
resolved substantially all repurchase liabilities associated with loans sold to
FHLMC prior to January 1, 2009 and loans sold to FNMA that were originated
prior to January 1, 2009.
Wells Fargo & Company
195