Wells Fargo 2015 Annual Report Download - page 50
Download and view the complete annual report
Please find page 50 of the 2015 Wells Fargo annual report below. You can navigate through the pages in the report by either clicking on the pages listed below, or by using the keyword search tool below to find specific information within the annual report.-
 1
1 -
2
-
3
-
4
-
5
-
6
-
7
-
8
-
9
-
10
-
11
-
12
-
13
-
14
-
15
-
16
-
17
-
18
-
19
-
20
-
21
-
22
-
23
-
24
-
25
-
26
-
27
-
28
-
29
-
30
-
31
-
32
-
33
-
34
-
35
-
36
-
37
-
38
-
39
-
 40
40 -
 41
41 -
 42
42 -
 43
43 -
 44
44 -
 45
45 -
 46
46 -
 47
47 -
 48
48 -
 49
49 -
 50
50 -
 51
51 -
 52
52 -
 53
53 -
 54
54 -
 55
55 -
 56
56 -
 57
57 -
 58
58 -
 59
59 -
 60
60 -
61
-
62
-
63
-
64
-
65
-
66
-
67
-
68
-
69
-
70
-
71
-
72
-
73
-
74
-
75
-
76
-
77
-
78
-
79
-
80
-
81
-
82
-
83
-
84
-
85
-
86
-
87
-
88
-
89
-
90
-
91
-
92
-
93
-
94
-
95
-
96
-
97
-
98
-
99
-
100
-
101
-
102
-
103
-
104
-
105
-
106
-
107
-
108
-
109
-
110
-
111
-
112
-
113
-
114
-
115
-
116
-
117
-
118
-
119
-
120
-
121
-
122
-
123
-
124
-
125
-
126
-
127
-
128
-
129
-
130
-
131
-
132
-
133
-
134
-
135
-
136
-
137
-
138
-
139
-
140
-
141
-
142
-
143
-
144
-
145
-
146
-
147
-
148
-
149
-
150
-
151
-
152
-
153
-
154
-
155
-
156
-
157
-
158
-
159
-
160
-
161
-
162
-
163
-
164
-
165
-
166
-
167
-
168
-
169
-
170
-
171
-
172
-
173
-
174
-
175
-
176
-
177
-
178
-
179
-
180
-
181
-
182
-
183
-
184
-
185
-
186
-
187
-
188
-
189
-
190
-
191
-
192
-
193
-
194
-
195
-
196
-
197
-
198
-
199
-
200
-
201
-
202
-
203
-
204
-
205
-
206
-
207
-
208
-
209
-
210
-
211
-
212
-
213
-
214
-
215
-
216
-
217
-
218
-
219
-
220
-
221
-
222
-
223
-
224
-
225
-
226
-
227
-
228
-
229
-
230
-
231
-
232
-
233
-
234
-
235
-
236
-
237
-
238
-
239
-
240
-
241
-
242
-
243
-
244
-
245
-
246
-
247
-
248
-
249
-
250
-
251
-
252
-
253
-
254
-
255
-
256
-
257
-
258
-
259
-
260
-
261
-
262
-
263
-
264
-
265
-
266
-
267
-
268
-
269
-
270
-
271
-
272
-
273
 |
 |
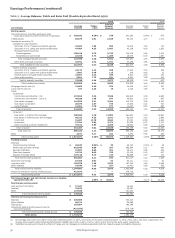
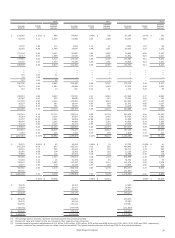
Earnings Performance (continued)
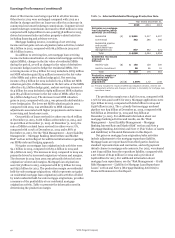
Community Banking reported net income of $13.5 billion in
2015, down $195 million, or 1%, from $13.7 billion in 2014,
which was up 13% from $12.1 billion in 2013. Revenue was
$49.3 billion in 2015, an increase of $1.2 billion, or 2%,
compared with $48.2 billion in 2014, which was up 1%
compared with $47.7 billion in 2013. The increase in revenue for
2015 was primarily driven by higher net interest income, gains
on sale of debt securities, debit and credit card fees, and trust
and investment fees, partially offset by lower gains from trading
activities, deferred compensation plan investment gains (offset
in employee benefits expense) and other income. Lower other
income in 2015, compared with 2014, reflected a gain on sale of
government guaranteed student loans in 2014 and lower
ineffectiveness gains in 2015 on derivatives that qualify for
hedge accounting. The increase in revenue for 2014, compared
with 2013, was primarily driven by higher net interest income,
gains on sale of equity investments and debt securities, higher
trust and investment fees, and higher card fees, partially offset
by lower mortgage banking revenue, the phase out of the direct
deposit advance product during the first half of 2014, and lower
deferred compensation plan investment gains (offset in
employee benefits expense). Higher other income for 2014
compared with 2013 reflected larger ineffectiveness gains on
derivatives that qualify for hedge accounting and a gain on sale
of government guaranteed student loans in fourth quarter 2014.
Average deposits increased $40.1 billion in 2015, or 7%, from
2014, which increased $119.6 billion, or 24%, from 2013.
Noninterest expense increased $691 million in 2015, or 3%, from
2014, which declined $800 million, or 3%, from 2013. The
increase in noninterest expense for 2015 largely reflected higher
personnel expense, operating losses, equipment expense, and a
$126 million donation to the Wells Fargo Foundation, partially
offset by lower deferred compensation expense (offset in
revenue), foreclosed assets, travel, data processing, occupancy
and various other expenses. The decrease in noninterest expense
for 2014 largely reflected lower mortgage volume-related
expenses and deferred compensation expense (offset in
revenue), partially offset by higher operating losses. The
provision for credit losses of $2.4 billion in 2015 was
$631 million, or 35%, higher than 2014, which was $1.0 billion,
or 37%, lower than 2013. The increase in provision in 2015 was
due to $1.1 billion lower allowance release, partially offset by
$403 million lower net charge-offs related to improvement in
the consumer real estate portfolio. The decrease in provision in
2014 was due to $1.5 billion lower net charge-offs related to the
consumer real estate portfoli0, partially offset by $454 million
lower allowance release.
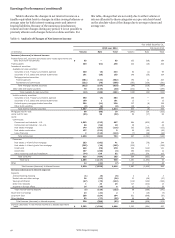
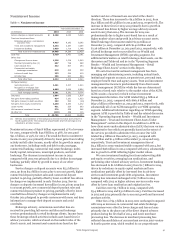
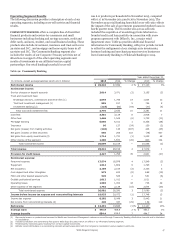
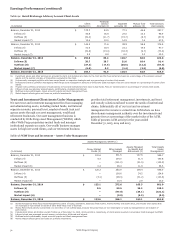
WHOLESALE BANKING provides financial solutions to
businesses across the United States and globally with annual
sales generally in excess of $5 million. Products and businesses
include Business Banking, Middle Market Commercial Banking,
Government and Institutional Banking, Corporate Banking,
Commercial Real Estate, Treasury Management, Wells Fargo
Capital Finance, Insurance, International, Real Estate Capital
Markets, Commercial Mortgage Servicing, Corporate Trust,
Equipment Finance, Wells Fargo Securities, Principal
Investments, and Asset Backed Finance. Wholesale Banking
cross-sell is reported on a one-quarter lag and for fourth quarter
2015 was 7.3 products per relationship, up from 7.2 for fourth
quarter 2014 and 7.1 for fourth quarter 2013. Wholesale Banking
cross-sell does not reflect Business Banking relationships, which
were realigned from Community Banking to Wholesale Banking
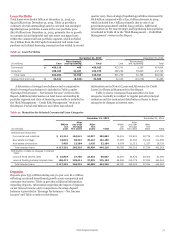
effective fourth quarter 2015. Table 9b provides additional
financial information for Wholesale Banking, with prior periods
revised to reflect the realignment of our asset management
business from Wholesale Banking to WIM; our reinsurance
business from WIM to Wholesale Banking; and our strategic
auto investments, business banking and merchant payment
services businesses from Community Banking to Wholesale
Banking in 2015.
Wells Fargo & Company
48