Wells Fargo 2015 Annual Report Download - page 241
Download and view the complete annual report
Please find page 241 of the 2015 Wells Fargo annual report below. You can navigate through the pages in the report by either clicking on the pages listed below, or by using the keyword search tool below to find specific information within the annual report.-
 1
1 -
2
-
3
-
4
-
5
-
6
-
7
-
8
-
9
-
10
-
11
-
12
-
13
-
14
-
15
-
16
-
17
-
18
-
19
-
20
-
21
-
22
-
23
-
24
-
25
-
26
-
27
-
28
-
29
-
30
-
31
-
32
-
33
-
34
-
35
-
36
-
37
-
38
-
39
-
40
-
41
-
42
-
43
-
44
-
45
-
46
-
47
-
48
-
49
-
50
-
51
-
52
-
53
-
54
-
55
-
56
-
57
-
58
-
59
-
60
-
61
-
62
-
63
-
64
-
65
-
66
-
67
-
68
-
69
-
70
-
71
-
72
-
73
-
74
-
75
-
76
-
77
-
78
-
79
-
80
-
81
-
82
-
83
-
84
-
85
-
86
-
87
-
88
-
89
-
90
-
91
-
92
-
93
-
94
-
95
-
96
-
97
-
98
-
99
-
100
-
101
-
102
-
103
-
104
-
105
-
106
-
107
-
108
-
109
-
110
-
111
-
112
-
113
-
114
-
115
-
116
-
117
-
118
-
119
-
120
-
121
-
122
-
123
-
124
-
125
-
126
-
127
-
128
-
129
-
130
-
131
-
132
-
133
-
134
-
135
-
136
-
137
-
138
-
139
-
140
-
141
-
142
-
143
-
144
-
145
-
146
-
147
-
148
-
149
-
150
-
151
-
152
-
153
-
154
-
155
-
156
-
157
-
158
-
159
-
160
-
161
-
162
-
163
-
164
-
165
-
166
-
167
-
168
-
169
-
170
-
171
-
172
-
173
-
174
-
175
-
176
-
177
-
178
-
179
-
180
-
181
-
182
-
183
-
184
-
185
-
186
-
187
-
188
-
189
-
190
-
191
-
192
-
193
-
194
-
195
-
196
-
197
-
198
-
199
-
200
-
201
-
202
-
203
-
204
-
205
-
206
-
207
-
208
-
209
-
210
-
211
-
212
-
213
-
214
-
215
-
216
-
217
-
218
-
219
-
220
-
221
-
222
-
223
-
224
-
225
-
226
-
227
-
228
-
229
-
230
-
 231
231 -
 232
232 -
 233
233 -
 234
234 -
 235
235 -
 236
236 -
 237
237 -
 238
238 -
 239
239 -
 240
240 -
 241
241 -
 242
242 -
 243
243 -
 244
244 -
 245
245 -
 246
246 -
 247
247 -
 248
248 -
 249
249 -
 250
250 -
 251
251 -
252
-
253
-
254
-
255
-
256
-
257
-
258
-
259
-
260
-
261
-
262
-
263
-
264
-
265
-
266
-
267
-
268
-
269
-
270
-
271
-
272
-
273
 |
 |

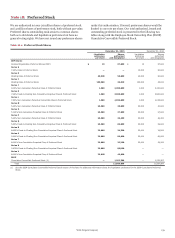
Note 18: Preferred Stock
We are authorized to issue 20 million shares of preferred stock
and 4 million shares of preference stock, both without par value.
Preferred shares outstanding rank senior to common shares
both as to dividends and liquidation preference but have no
general voting rights. We have not issued any preference shares
Table 18.1: Preferred Stock Shares
under this authorization. If issued, preference shares would be
limited to one vote per share. Our total authorized, issued and
outstanding preferred stock is presented in the following two
tables along with the Employee Stock Ownership Plan (ESOP)
Cumulative Convertible Preferred Stock.
December 31, 2015 December 31, 2014
Liquidation Shares Liquidation Shares
preference authorized preference authorized
per share and designated per share and designated
DEP Shares
Dividend Equalization Preferred Shares (DEP) $ 10 97,000 $ 10 97,000
Series G
7.25% Class A Preferred Stock — — 15,000 50,000
Series H
Floating Class A Preferred Stock 20,000 50,000 20,000 50,000
Series I
Floating Class A Preferred Stock 100,000 25,010 100,000 25,010
Series J
8.00% Non-Cumulative Perpetual Class A Preferred Stock 1,000 2,300,000 1,000 2,300,000
Series K
7.98% Fixed-to-Floating Non-Cumulative Perpetual Class A Preferred Stock 1,000 3,500,000 1,000 3,500,000
Series L
7.50% Non-Cumulative Perpetual Convertible Class A Preferred Stock 1,000 4,025,000 1,000 4,025,000
Series N
5.20% Non-Cumulative Perpetual Class A Preferred Stock 25,000 30,000 25,000 30,000
Series O
5.125% Non-Cumulative Perpetual Class A Preferred Stock 25,000 27,600 25,000 27,600
Series P
5.25% Non-Cumulative Perpetual Class A Preferred Stock 25,000 26,400 25,000 26,400
Series Q
5.85% Fixed-to-Floating Non-Cumulative Perpetual Class A Preferred Stock 25,000 69,000 25,000 69,000
Series R
6.625% Fixed-to-Floating Non-Cumulative Perpetual Class A Preferred Stock 25,000 34,500 25,000 34,500
Series S
5.900% Fixed-to-Floating Non-Cumulative Perpetual Class A Preferred Stock 25,000 80,000 25,000 80,000
Series T
6.000% Non-Cumulative Perpetual Class A Preferred Stock 25,000 32,200 25,000 32,200
Series U
5.875% Fixed-to-Floating Non-Cumulative Perpetual Class A Preferred Stock 25,000 80,000 — —
Series V
6.000% Non-Cumulative Perpetual Class A Preferred Stock 25,000 40,000 — —
ESOP
Cumulative Convertible Preferred Stock (1) — 1,252,386 — 1,251,287
Total 11,669,096 11,597,997
(1) See the ESOP Cumulative Convertible Preferred Stock section of this Note for additional information about the liquidation preference for the ESOP Cumulative Preferred
Stock.
Wells Fargo & Company
239