Wells Fargo 2015 Annual Report Download - page 49
Download and view the complete annual report
Please find page 49 of the 2015 Wells Fargo annual report below. You can navigate through the pages in the report by either clicking on the pages listed below, or by using the keyword search tool below to find specific information within the annual report.-
 1
1 -
2
-
3
-
4
-
5
-
6
-
7
-
8
-
9
-
10
-
11
-
12
-
13
-
14
-
15
-
16
-
17
-
18
-
19
-
20
-
21
-
22
-
23
-
24
-
25
-
26
-
27
-
28
-
29
-
30
-
31
-
32
-
33
-
34
-
35
-
36
-
37
-
38
-
 39
39 -
 40
40 -
 41
41 -
 42
42 -
 43
43 -
 44
44 -
 45
45 -
 46
46 -
 47
47 -
 48
48 -
 49
49 -
 50
50 -
 51
51 -
 52
52 -
 53
53 -
 54
54 -
 55
55 -
 56
56 -
 57
57 -
 58
58 -
 59
59 -
60
-
61
-
62
-
63
-
64
-
65
-
66
-
67
-
68
-
69
-
70
-
71
-
72
-
73
-
74
-
75
-
76
-
77
-
78
-
79
-
80
-
81
-
82
-
83
-
84
-
85
-
86
-
87
-
88
-
89
-
90
-
91
-
92
-
93
-
94
-
95
-
96
-
97
-
98
-
99
-
100
-
101
-
102
-
103
-
104
-
105
-
106
-
107
-
108
-
109
-
110
-
111
-
112
-
113
-
114
-
115
-
116
-
117
-
118
-
119
-
120
-
121
-
122
-
123
-
124
-
125
-
126
-
127
-
128
-
129
-
130
-
131
-
132
-
133
-
134
-
135
-
136
-
137
-
138
-
139
-
140
-
141
-
142
-
143
-
144
-
145
-
146
-
147
-
148
-
149
-
150
-
151
-
152
-
153
-
154
-
155
-
156
-
157
-
158
-
159
-
160
-
161
-
162
-
163
-
164
-
165
-
166
-
167
-
168
-
169
-
170
-
171
-
172
-
173
-
174
-
175
-
176
-
177
-
178
-
179
-
180
-
181
-
182
-
183
-
184
-
185
-
186
-
187
-
188
-
189
-
190
-
191
-
192
-
193
-
194
-
195
-
196
-
197
-
198
-
199
-
200
-
201
-
202
-
203
-
204
-
205
-
206
-
207
-
208
-
209
-
210
-
211
-
212
-
213
-
214
-
215
-
216
-
217
-
218
-
219
-
220
-
221
-
222
-
223
-
224
-
225
-
226
-
227
-
228
-
229
-
230
-
231
-
232
-
233
-
234
-
235
-
236
-
237
-
238
-
239
-
240
-
241
-
242
-
243
-
244
-
245
-
246
-
247
-
248
-
249
-
250
-
251
-
252
-
253
-
254
-
255
-
256
-
257
-
258
-
259
-
260
-
261
-
262
-
263
-
264
-
265
-
266
-
267
-
268
-
269
-
270
-
271
-
272
-
273
 |
 |

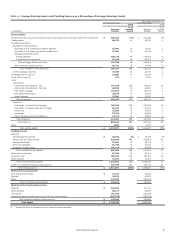
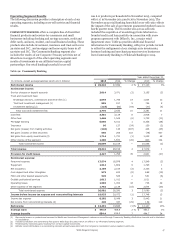
Operating Segment Results
The following discussion provides a description of each of our
operating segments, including cross-sell metrics and financial
results.
COMMUNITY BANKING offers a complete line of diversified
financial products and services for consumers and small
businesses including checking and savings accounts, credit and
debit cards, and auto, student, and small business lending. These
products also include investment, insurance and trust services in
39 states and D.C., and mortgage and home equity loans in all
50 states and D.C. The Community Banking segment also
includes the results of our Corporate Treasury activities net of
allocations in support of the other operating segments and
results of investments in our affiliated venture capital
partnerships. Our retail banking household cross-sell
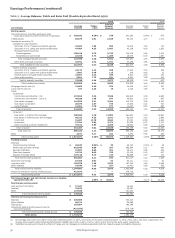
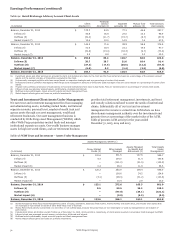
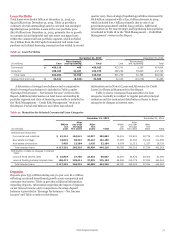
Table 9a: Community Banking
was 6.11 products per household in November 2015, compared
with 6.17 in November 2014 and 6.16 in November 2013. The
November 2015 retail banking household cross-sell ratio reflects
the impact of the sale of government guaranteed student loans in
fourth quarter 2014. The November 2014 cross-sell ratio
included the acquisition of an existing private label and co-
branded credit card loan portfolio in connection with a new
program agreement with Dillard's, Inc., a major retail
department store. Table 9a provides additional financial
information for Community Banking, with prior periods revised
to reflect the realignment of our strategic auto investments,
business banking and merchant payment services businesses
from Community Banking to Wholesale Banking in 2015.
Year ended December 31,
(in millions, except average balances which are in billions) 2015 2014 % Change 2013 % Change
Net interest income $ 29,242 27,999 4 % $ 27,123 3%
Noninterest income:
Service charges on deposit accounts 3,014 3,071 (2) 3,155 (3)
Trust and investment fees:
Brokerage advisory, commissions and other fees (1) 2,044 1,796 14 1,604 12
Trust and investment management (1) 855 817 5 754 8
Investment banking (2) (123) (80) (54) (77) (4)
Total trust and investment fees 2,776 2,533 10 2,281 11
Card fees 3,381 3,119 8 2,918 7
Other fees 1,446 1,545 (6) 1,735 (11)
Mortgage banking 6,056 6,011 1 8,336 (28)
Insurance 96 127 (24) 130 (2)
Net gains (losses) from trading activities (146) 136 (207) 246 (45)
Net gains (losses) on debt securities 556 255 118 (78) 427
Net gains from equity investments (3) 1,714 1,731 (1) 1,033 68
Other income of the segment 1,206 1,631 (26) 800 104
Total noninterest income 20,099 20,159 — 20,556 (2)
Total revenue 49,341 48,158 2 47,679
Provision for credit losses 2,427 1,796 35 2,841 (37)
Noninterest expense:
Personnel expense 17,574 16,979 4 17,549 (3)
Equipment 1,914 1,809 6 1,795 1
Net occupancy 2,104 2,154 (2) 2,105 2
Core deposit and other intangibles 573 620 (8) 689 (10)
FDIC and other deposit assessments 549 526 4 561 (6)
Outside professional services 1,012 1,011 — 1,011 —
Operating losses 1,503 1,052 43 706 49
Other expense of the segment 1,752 2,139 (18) 2,674 (20)
Total noninterest expense 26,981 26,290 3 27,090 (3)
Income before income tax expense and noncontrolling interests 19,933 20,072 (1) 17,748 13
Income tax expense 6,202 6,049 3 5,442 11
Net income from noncontrolling interests (4) 240 337 (29) 159 112
Net income $ 13,491 13,686 (1)% $ 12,147 13%
Average loans $ 475.9 468.8 2 % $ 465.1 1%
Average deposits 654.4 614.3 7 494.7 24
(1) Represents income on products and services for Wealth and Investment Management customers served through Community Banking distribution channels and is eliminated
in consolidation.
(2) Includes syndication and underwriting fees paid to Wells Fargo Securities which are offset in our Wholesale Banking segment.
(3) Predominantly represents gains resulting from venture capital investments.
(4) Reflects results attributable to noncontrolling interests primarily associated with the Company’s consolidated venture capital investments.
Wells Fargo & Company
1
47