Wells Fargo 2015 Annual Report Download - page 84
Download and view the complete annual report
Please find page 84 of the 2015 Wells Fargo annual report below. You can navigate through the pages in the report by either clicking on the pages listed below, or by using the keyword search tool below to find specific information within the annual report.-
 1
1 -
2
-
3
-
4
-
5
-
6
-
7
-
8
-
9
-
10
-
11
-
12
-
13
-
14
-
15
-
16
-
17
-
18
-
19
-
20
-
21
-
22
-
23
-
24
-
25
-
26
-
27
-
28
-
29
-
30
-
31
-
32
-
33
-
34
-
35
-
36
-
37
-
38
-
39
-
40
-
41
-
42
-
43
-
44
-
45
-
46
-
47
-
48
-
49
-
50
-
51
-
52
-
53
-
54
-
55
-
56
-
57
-
58
-
59
-
60
-
61
-
62
-
63
-
64
-
65
-
66
-
67
-
68
-
69
-
70
-
71
-
72
-
73
-
 74
74 -
 75
75 -
 76
76 -
 77
77 -
 78
78 -
 79
79 -
 80
80 -
 81
81 -
 82
82 -
 83
83 -
 84
84 -
 85
85 -
 86
86 -
 87
87 -
 88
88 -
 89
89 -
 90
90 -
 91
91 -
 92
92 -
 93
93 -
 94
94 -
95
-
96
-
97
-
98
-
99
-
100
-
101
-
102
-
103
-
104
-
105
-
106
-
107
-
108
-
109
-
110
-
111
-
112
-
113
-
114
-
115
-
116
-
117
-
118
-
119
-
120
-
121
-
122
-
123
-
124
-
125
-
126
-
127
-
128
-
129
-
130
-
131
-
132
-
133
-
134
-
135
-
136
-
137
-
138
-
139
-
140
-
141
-
142
-
143
-
144
-
145
-
146
-
147
-
148
-
149
-
150
-
151
-
152
-
153
-
154
-
155
-
156
-
157
-
158
-
159
-
160
-
161
-
162
-
163
-
164
-
165
-
166
-
167
-
168
-
169
-
170
-
171
-
172
-
173
-
174
-
175
-
176
-
177
-
178
-
179
-
180
-
181
-
182
-
183
-
184
-
185
-
186
-
187
-
188
-
189
-
190
-
191
-
192
-
193
-
194
-
195
-
196
-
197
-
198
-
199
-
200
-
201
-
202
-
203
-
204
-
205
-
206
-
207
-
208
-
209
-
210
-
211
-
212
-
213
-
214
-
215
-
216
-
217
-
218
-
219
-
220
-
221
-
222
-
223
-
224
-
225
-
226
-
227
-
228
-
229
-
230
-
231
-
232
-
233
-
234
-
235
-
236
-
237
-
238
-
239
-
240
-
241
-
242
-
243
-
244
-
245
-
246
-
247
-
248
-
249
-
250
-
251
-
252
-
253
-
254
-
255
-
256
-
257
-
258
-
259
-
260
-
261
-
262
-
263
-
264
-
265
-
266
-
267
-
268
-
269
-
270
-
271
-
272
-
273
 |
 |

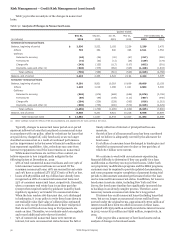
Risk Management – Credit Risk Management (continued)
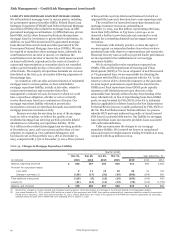
LOANS 90 DAYS OR MORE PAST DUE AND STILL ACCRUING
Loans 90 days or more past due as to interest or principal are
still accruing if they are (1) well-secured and in the process of
collection or (2) real estate 1-4 family mortgage loans or
consumer loans exempt under regulatory rules from being
classified as nonaccrual until later delinquency, usually 120 days
past due. PCI loans are not included in past due and still
accruing loans even though they are 90 days or more
contractually past due. These PCI loans are considered to be
accruing because they continue to earn interest from accretable
yield, independent of performance in accordance with their
contractual terms.
Excluding insured/guaranteed loans, loans 90 days or more
past due and still accruing at December 31, 2015, were up
$61 million, or 7%, from December 31, 2014, primarily due to
increases in our credit card and dealer floorplan lending
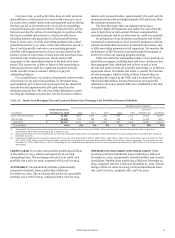
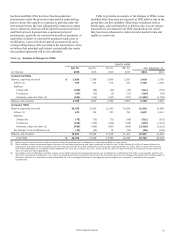
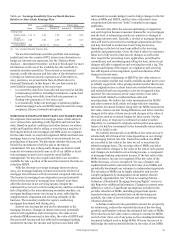
Table 36: Loans 90 Days or More Past Due and Still Accruing
businesses, partially offset by improvement in consumer real
estate lending.
Loans 90 days or more past due and still accruing whose
repayments are predominantly insured by the FHA or
guaranteed by the VA for mortgages and the U.S. Department of
Education for student loans under the Federal Family Education
Loan Program (FFELP) were $13.4 billion at December 31, 2015,
down from $16.9 billion at December 31, 2014, due to improving
credit trends.
Table 36 reflects non-PCI loans 90 days or more past due
and still accruing by class for loans not government insured/
guaranteed. For additional information on delinquencies by loan
class, see Note 6 (Loans and Allowance for Credit Losses) to
Financial Statements in this Report.
December 31,
(in millions) 2015 2014 2013 2012 2011
Total (excluding PCI (1)): $ 14,380 17,810 23,219 23,245 22,569
Less: FHA insured/guaranteed by the VA (2)(3) 13,373 16,827 21,274 20,745 19,240
Less: Student loans guaranteed under the FFELP (4) 26 63 900 1,065 1,281
Total, not government insured/guaranteed $ 981 920 1,045 1,435 2,048
By segment and class, not government insured/guaranteed:
Commercial:
Commercial and industrial $ 97 31 11 48 159
Real estate mortgage 13 16 35 228 256
Real estate construction 4 — 97 27 89
Total commercial 114 47 143 303 504
Consumer:
Real estate 1-4 family first mortgage (3) 224 260 354 564 781
Real estate 1-4 family junior lien mortgage (3) 65 83 86 133 279
Credit card 397 364 321 310 346
Automobile 79 73 55 40 51
Other revolving credit and installment 102 93 86 85 87
Total consumer 867 873 902 1,132 1,544
Total, not government insured/guaranteed $ 981 920 1,045 1,435 2,048
(1) PCI loans totaled $2.9 billion, $3.7 billion, $4.5 billion, $6.0 billion and $8.7 billion at December 31, 2015, 2014, 2013, 2012 and 2011, respectively.
(2) Represents loans whose repayments are predominantly insured by the FHA or guaranteed by the VA.
(3) Includes mortgages held for sale 90 days or more past due and still accruing.
(4) Represents loans whose repayments are predominantly guaranteed by agencies on behalf of the U.S. Department of Education under the FFELP. In fourth quarter 2014,
substantially all government guaranteed loans were sold.
Wells Fargo & Company
82