Wells Fargo 2015 Annual Report Download - page 40
Download and view the complete annual report
Please find page 40 of the 2015 Wells Fargo annual report below. You can navigate through the pages in the report by either clicking on the pages listed below, or by using the keyword search tool below to find specific information within the annual report.-
 1
1 -
2
-
3
-
4
-
5
-
6
-
7
-
8
-
9
-
10
-
11
-
12
-
13
-
14
-
15
-
16
-
17
-
18
-
19
-
20
-
21
-
22
-
23
-
24
-
25
-
26
-
27
-
28
-
29
-
 30
30 -
 31
31 -
 32
32 -
 33
33 -
 34
34 -
 35
35 -
 36
36 -
 37
37 -
 38
38 -
 39
39 -
 40
40 -
 41
41 -
 42
42 -
 43
43 -
 44
44 -
 45
45 -
 46
46 -
 47
47 -
 48
48 -
 49
49 -
 50
50 -
51
-
52
-
53
-
54
-
55
-
56
-
57
-
58
-
59
-
60
-
61
-
62
-
63
-
64
-
65
-
66
-
67
-
68
-
69
-
70
-
71
-
72
-
73
-
74
-
75
-
76
-
77
-
78
-
79
-
80
-
81
-
82
-
83
-
84
-
85
-
86
-
87
-
88
-
89
-
90
-
91
-
92
-
93
-
94
-
95
-
96
-
97
-
98
-
99
-
100
-
101
-
102
-
103
-
104
-
105
-
106
-
107
-
108
-
109
-
110
-
111
-
112
-
113
-
114
-
115
-
116
-
117
-
118
-
119
-
120
-
121
-
122
-
123
-
124
-
125
-
126
-
127
-
128
-
129
-
130
-
131
-
132
-
133
-
134
-
135
-
136
-
137
-
138
-
139
-
140
-
141
-
142
-
143
-
144
-
145
-
146
-
147
-
148
-
149
-
150
-
151
-
152
-
153
-
154
-
155
-
156
-
157
-
158
-
159
-
160
-
161
-
162
-
163
-
164
-
165
-
166
-
167
-
168
-
169
-
170
-
171
-
172
-
173
-
174
-
175
-
176
-
177
-
178
-
179
-
180
-
181
-
182
-
183
-
184
-
185
-
186
-
187
-
188
-
189
-
190
-
191
-
192
-
193
-
194
-
195
-
196
-
197
-
198
-
199
-
200
-
201
-
202
-
203
-
204
-
205
-
206
-
207
-
208
-
209
-
210
-
211
-
212
-
213
-
214
-
215
-
216
-
217
-
218
-
219
-
220
-
221
-
222
-
223
-
224
-
225
-
226
-
227
-
228
-
229
-
230
-
231
-
232
-
233
-
234
-
235
-
236
-
237
-
238
-
239
-
240
-
241
-
242
-
243
-
244
-
245
-
246
-
247
-
248
-
249
-
250
-
251
-
252
-
253
-
254
-
255
-
256
-
257
-
258
-
259
-
260
-
261
-
262
-
263
-
264
-
265
-
266
-
267
-
268
-
269
-
270
-
271
-
272
-
273
 |
 |

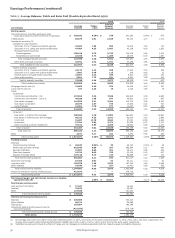
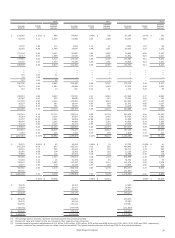
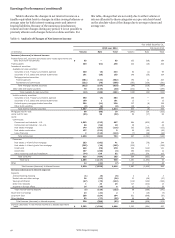
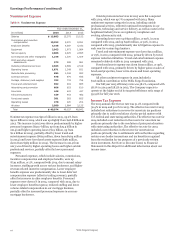
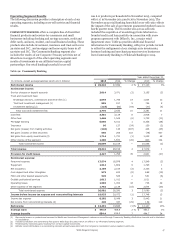
Earnings Performance (continued)
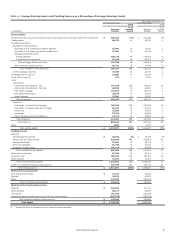
Table 5: Average Balances, Yields and Rates Paid (Taxable-Equivalent Basis) (1)(2)
2015 2014
Interest Interest
Average Yields/ income/ Average Yields/ income/
(in millions) balance rates expense balance rates expense
Earning assets
Federal funds sold, securities purchased under
resale agreements and other short-term investments $ 266,832 0.28% $ 738 241,282 0.28% $ 673
Trading assets 66,679 3.01 2,010 55,140 3.10 1,712
Investment securities (3):
Available-for-sale securities:
Securities of U.S. Treasury and federal agencies 32,093 1.58 505 10,400 1.64 171
Securities of U.S. states and political subdivisions 47,404 4.23 2,007 43,138 4.29 1,852
Mortgage-backed securities:
Federal agencies 100,218 2.73 2,733 114,076 2.84 3,235
Residential and commercial 22,490 5.73 1,289 26,475 6.03 1,597
Total mortgage-backed securities 122,708 3.28 4,022 140,551 3.44 4,832
Other debt and equity securities 49,752 3.42 1,701 47,488 3.66 1,741
Total available-for-sale securities 251,957 3.27 8,235 241,577 3.56 8,596
Held-to-maturity securities:
Securities of U.S. Treasury and federal agencies 44,173 2.19 968 17,239 2.23 385
Securities of U.S. states and political subdivisions 2,087 5.40 113 246 4.93 12
Federal agency mortgage-backed securities 21,967 2.23 489 5,921 2.55 151
Other debt securities 5,821 1.73 101 5,913 1.85 109
Held-to-maturity securities 74,048 2.26 1,671 29,319 2.24 657
Total investment securities 326,005 3.04 9,906 270,896 3.42 9,253
Mortgages held for sale (4) 21,603 3.63 785 19,018 4.03 767
Loans held for sale (4) 573 3.25 19 4,226 1.85 78
Loans:
Commercial:
Commercial and industrial - U.S. 237,844 3.29 7,836 204,819 3.35 6,869
Commercial and industrial - non U.S. 46,028 1.90 877 42,661 2.03 867
Real estate mortgage 116,893 3.41 3,984 112,710 3.64 4,100
Real estate construction 20,979 3.57 749 17,676 4.21 744
Lease financing 12,301 4.70 577 12,257 5.63 690
Total commercial 434,045 3.23 14,023 390,123 3.40 13,270
Consumer:
Real estate 1-4 family first mortgage 268,560 4.10 11,002 261,620 4.19 10,961
Real estate 1-4 family junior lien mortgage 56,242 4.25 2,391 62,510 4.30 2,686
Credit card 31,307 11.70 3,664 27,491 11.98 3,294
Automobile 57,766 5.84 3,374 53,854 6.27 3,377
Other revolving credit and installment 37,512 5.89 2,209 38,834 5.48 2,127
Total consumer 451,387 5.02 22,640 444,309 5.05 22,445
Total loans (4) 885,432 4.14 36,663 834,432 4.28 35,715
Other 4,947 5.11 252 4,673 5.54 259
Total earning assets $ 1,572,071 3.20% $ 50,373 1,429,667 3.39% $ 48,457
Funding sources
Deposits:
Interest-bearing checking $ 38,640 0.05% $ 20 39,729 0.07% $ 26
Market rate and other savings 625,549 0.06 367 585,854 0.07 403
Savings certificates 31,887 0.63 201 38,111 0.85 323
Other time deposits 51,790 0.45 232 51,434 0.40 207
Deposits in foreign offices 107,138 0.13 143 95,889 0.14 137
Total interest-bearing deposits 855,004 0.11 963 811,017 0.14 1,096
Short-term borrowings 87,465 0.07 64 60,111 0.10 62
Long-term debt 185,078 1.40 2,592 167,420 1.49 2,488
Other liabilities 16,545 2.15 357 14,401 2.65 382
Total interest-bearing liabilities 1,144,092 0.35 3,976 1,052,949 0.38 4,028
Portion of noninterest-bearing funding sources 427,979 — — 376,718 — —
Total funding sources $ 1,572,071 0.25 3,976 1,429,667 0.28 4,028
Net interest margin and net interest income on a taxable-
equivalent basis (5) 2.95% $ 46,397 3.11% $ 44,429
Noninterest-earning assets
Cash and due from banks $ 17,327 16,361
Goodwill 25,673 25,687
Other 127,848 121,634
Total noninterest-earning assets $ 170,848 163,682
Noninterest-bearing funding sources
Deposits $ 339,069 303,127
Other liabilities 68,174 56,985
Total equity 191,584 180,288
Noninterest-bearing funding sources used to
fund earning assets (427,979) (376,718)
Net noninterest-bearing funding sources $ 170,848 163,682
Total assets $ 1,742,919 1,593,349
(1) Our average prime rate was 3.26% for the year ended December 31, 2015, and 3.25% for the years ended December 31, 2014, 2013, 2012, and 2011, respectively. The
average three-month London Interbank Offered Rate (LIBOR) was 0.32%, 0.23%, 0.27%, 0.43%, and 0.34% for the same years, respectively.
(2) Yield/rates and amounts include the effects of hedge and risk management activities associated with the respective asset and liability categories.
Wells Fargo & Company
38