Wells Fargo 2015 Annual Report Download - page 100
Download and view the complete annual report
Please find page 100 of the 2015 Wells Fargo annual report below. You can navigate through the pages in the report by either clicking on the pages listed below, or by using the keyword search tool below to find specific information within the annual report.-
 1
1 -
2
-
3
-
4
-
5
-
6
-
7
-
8
-
9
-
10
-
11
-
12
-
13
-
14
-
15
-
16
-
17
-
18
-
19
-
20
-
21
-
22
-
23
-
24
-
25
-
26
-
27
-
28
-
29
-
30
-
31
-
32
-
33
-
34
-
35
-
36
-
37
-
38
-
39
-
40
-
41
-
42
-
43
-
44
-
45
-
46
-
47
-
48
-
49
-
50
-
51
-
52
-
53
-
54
-
55
-
56
-
57
-
58
-
59
-
60
-
61
-
62
-
63
-
64
-
65
-
66
-
67
-
68
-
69
-
70
-
71
-
72
-
73
-
74
-
75
-
76
-
77
-
78
-
79
-
80
-
81
-
82
-
83
-
84
-
85
-
86
-
87
-
88
-
89
-
 90
90 -
 91
91 -
 92
92 -
 93
93 -
 94
94 -
 95
95 -
 96
96 -
 97
97 -
 98
98 -
 99
99 -
 100
100 -
 101
101 -
 102
102 -
 103
103 -
 104
104 -
 105
105 -
 106
106 -
 107
107 -
 108
108 -
 109
109 -
 110
110 -
111
-
112
-
113
-
114
-
115
-
116
-
117
-
118
-
119
-
120
-
121
-
122
-
123
-
124
-
125
-
126
-
127
-
128
-
129
-
130
-
131
-
132
-
133
-
134
-
135
-
136
-
137
-
138
-
139
-
140
-
141
-
142
-
143
-
144
-
145
-
146
-
147
-
148
-
149
-
150
-
151
-
152
-
153
-
154
-
155
-
156
-
157
-
158
-
159
-
160
-
161
-
162
-
163
-
164
-
165
-
166
-
167
-
168
-
169
-
170
-
171
-
172
-
173
-
174
-
175
-
176
-
177
-
178
-
179
-
180
-
181
-
182
-
183
-
184
-
185
-
186
-
187
-
188
-
189
-
190
-
191
-
192
-
193
-
194
-
195
-
196
-
197
-
198
-
199
-
200
-
201
-
202
-
203
-
204
-
205
-
206
-
207
-
208
-
209
-
210
-
211
-
212
-
213
-
214
-
215
-
216
-
217
-
218
-
219
-
220
-
221
-
222
-
223
-
224
-
225
-
226
-
227
-
228
-
229
-
230
-
231
-
232
-
233
-
234
-
235
-
236
-
237
-
238
-
239
-
240
-
241
-
242
-
243
-
244
-
245
-
246
-
247
-
248
-
249
-
250
-
251
-
252
-
253
-
254
-
255
-
256
-
257
-
258
-
259
-
260
-
261
-
262
-
263
-
264
-
265
-
266
-
267
-
268
-
269
-
270
-
271
-
272
-
273
 |
 |

Risk Management - Asset/Liability Management (continued)
MARKET RISK – EQUITY INVESTMENTS We are directly and
indirectly affected by changes in the equity markets. We make
and manage direct equity investments in start-up businesses,
emerging growth companies, management buy-outs,
acquisitions and corporate recapitalizations. We also invest in
non-affiliated funds that make similar private equity
investments. These private equity investments are made within
capital allocations approved by management and the Board. The
Board’s policy is to review business developments, key risks and
historical returns for the private equity investment portfolio at
least annually. Management reviews these investments at least
quarterly and assesses them for possible OTTI. For
nonmarketable investments, the analysis is based on facts and
circumstances of each individual investment and the
expectations for that investment’s cash flows and capital needs,
the viability of its business model and our exit strategy.
Nonmarketable investments include private equity investments
accounted for under the cost method, equity method and fair
value option.
In conjunction with the March 2008 initial public offering
(IPO) of Visa, Inc. (Visa), we received approximately
20.7 million shares of Visa Class B common stock, which was
apportioned to member banks of Visa at the time of the IPO. To
manage our exposure to Visa and realize the value of the
appreciated Visa shares, we incrementally sold these shares
through a series of sales over the past few years, thereby
eliminating this position as of September 30, 2015. As part of
these sales, we agreed to compensate the buyer for any
additional contributions to a litigation settlement fund for the
litigation matters associated with the Class B shares we sold. Our
exposure to this retained litigation risk has been reflected on our
balance sheet.
As part of our business to support our customers, we trade
public equities, listed/OTC equity derivatives and convertible
bonds. We have parameters that govern these activities. We also
have marketable equity securities in the available-for-sale
securities portfolio, including securities relating to our venture
capital activities. We manage these investments within capital
risk limits approved by management and the Board and
monitored by Corporate ALCO and the Corporate Market Risk
Committee. Gains and losses on these securities are recognized
in net income when realized and periodically include OTTI
charges.
Changes in equity market prices may also indirectly affect
our net income by (1) the value of third party assets under
management and, hence, fee income, (2) borrowers whose
ability to repay principal and/or interest may be affected by the
stock market, or (3) brokerage activity, related commission
income and other business activities. Each business line
monitors and manages these indirect risks.
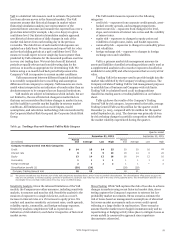
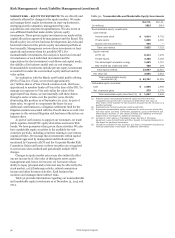
Table 50 provides information regarding our nonmarketable
and marketable equity investments as of December 31, 2015 and
2014.
Table 50: Nonmarketable and Marketable Equity Investments
Dec 31, Dec 31,
(in millions) 2015 2014
Nonmarketable equity investments:
Cost method:
Federal bank stock $ 4,814 4,733
Private equity 1,626 2,300
Auction rate securities (1) 595 —
Total cost method 7,035 7,033
Equity method:
LIHTC (2) 8,314 7,278
Private equity 3,300 3,043
Tax-advantaged renewable energy 1,625 1,710
New market tax credit and other 408 379
Total equity method 13,647 12,410
Fair value (3) 3,065 2,512
Total nonmarketable equity
investments (4) $ 23,747 21,955
Marketable equity securities:
Cost $ 1,058 1,906
Net unrealized gains 579 1,770
Total marketable equity securities (5) $ 1,637 3,676
(1) Reflects auction rate perpetual preferred equity securities that were
reclassified during 2015 with a cost basis of $689 million (fair value of
$640 million) from available-for-sale securities because they do not trade on a
qualified exchange.
(2) Represents low income housing tax credit investments.
(3) Represents nonmarketable equity investments for which we have elected the
fair value option. See Note 7 (Premises, Equipment, Lease Commitments and
Other Assets) and Note 17 (Fair Values of Assets and Liabilities) to Financial
Statements in this Report for additional information.
(4) Included in other assets on the balance sheet. See Note 7 (Premises,
Equipment, Lease Commitments and Other Assets) to Financial Statements in
this Report for additional information.
(5) Included in available-for-sale securities. See Note 5 (Investment Securities) to
Financial Statements in this Report for additional information.
Wells Fargo & Company
98