Wells Fargo 2015 Annual Report Download - page 170
Download and view the complete annual report
Please find page 170 of the 2015 Wells Fargo annual report below. You can navigate through the pages in the report by either clicking on the pages listed below, or by using the keyword search tool below to find specific information within the annual report.-
 1
1 -
2
-
3
-
4
-
5
-
6
-
7
-
8
-
9
-
10
-
11
-
12
-
13
-
14
-
15
-
16
-
17
-
18
-
19
-
20
-
21
-
22
-
23
-
24
-
25
-
26
-
27
-
28
-
29
-
30
-
31
-
32
-
33
-
34
-
35
-
36
-
37
-
38
-
39
-
40
-
41
-
42
-
43
-
44
-
45
-
46
-
47
-
48
-
49
-
50
-
51
-
52
-
53
-
54
-
55
-
56
-
57
-
58
-
59
-
60
-
61
-
62
-
63
-
64
-
65
-
66
-
67
-
68
-
69
-
70
-
71
-
72
-
73
-
74
-
75
-
76
-
77
-
78
-
79
-
80
-
81
-
82
-
83
-
84
-
85
-
86
-
87
-
88
-
89
-
90
-
91
-
92
-
93
-
94
-
95
-
96
-
97
-
98
-
99
-
100
-
101
-
102
-
103
-
104
-
105
-
106
-
107
-
108
-
109
-
110
-
111
-
112
-
113
-
114
-
115
-
116
-
117
-
118
-
119
-
120
-
121
-
122
-
123
-
124
-
125
-
126
-
127
-
128
-
129
-
130
-
131
-
132
-
133
-
134
-
135
-
136
-
137
-
138
-
139
-
140
-
141
-
142
-
143
-
144
-
145
-
146
-
147
-
148
-
149
-
150
-
151
-
152
-
153
-
154
-
155
-
156
-
157
-
158
-
159
-
 160
160 -
 161
161 -
 162
162 -
 163
163 -
 164
164 -
 165
165 -
 166
166 -
 167
167 -
 168
168 -
 169
169 -
 170
170 -
 171
171 -
 172
172 -
 173
173 -
 174
174 -
 175
175 -
 176
176 -
 177
177 -
 178
178 -
 179
179 -
 180
180 -
181
-
182
-
183
-
184
-
185
-
186
-
187
-
188
-
189
-
190
-
191
-
192
-
193
-
194
-
195
-
196
-
197
-
198
-
199
-
200
-
201
-
202
-
203
-
204
-
205
-
206
-
207
-
208
-
209
-
210
-
211
-
212
-
213
-
214
-
215
-
216
-
217
-
218
-
219
-
220
-
221
-
222
-
223
-
224
-
225
-
226
-
227
-
228
-
229
-
230
-
231
-
232
-
233
-
234
-
235
-
236
-
237
-
238
-
239
-
240
-
241
-
242
-
243
-
244
-
245
-
246
-
247
-
248
-
249
-
250
-
251
-
252
-
253
-
254
-
255
-
256
-
257
-
258
-
259
-
260
-
261
-
262
-
263
-
264
-
265
-
266
-
267
-
268
-
269
-
270
-
271
-
272
-
273
 |
 |

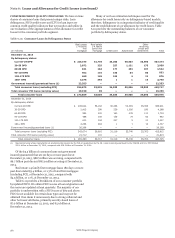
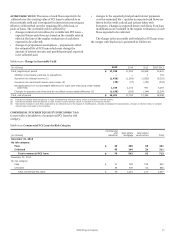
Note 6: Loans and Allowance for Credit Losses (continued)
CONSUMER CREDIT QUALITY INDICATORS We have various
classes of consumer loans that present unique risks. Loan
delinquency, FICO credit scores and LTV for loan types are
common credit quality indicators that we monitor and utilize in
our evaluation of the appropriateness of the allowance for credit
losses for the consumer portfolio segment.
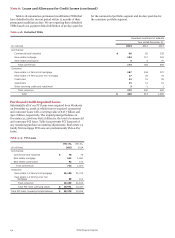
Table 6.10: Consumer Loans by Delinquency Status
Many of our loss estimation techniques used for the
allowance for credit losses rely on delinquency-based models;
therefore, delinquency is an important indicator of credit quality
and the establishment of our allowance for credit losses. Table
6.10 provides the outstanding balances of our consumer
portfolio by delinquency status.
Real estate Real estate Other
(in millions)
1-4 family
first
mortgage
1-4 family
junior lien
mortgage Credit card Automobile
revolving
credit and
installment Total
December 31, 2015
By delinquency status:
Current-29 DPD $ 225,195 51,778 33,208 58,503 38,690 407,374
30-59 DPD 2,072 325 257 1,121 175 3,950
60-89 DPD 821 184 177 253 107 1,542
90-119 DPD 402 110 150 84 86 832
120-179 DPD 460 145 246 4 21 876
180+ DPD 3,376 393 1 1 19 3,790
Government insured/guaranteed loans (1) 22,353 — — — — 22,353
Total consumer loans (excluding PCI) 254,679 52,935 34,039 59,966 39,098 440,717
Total consumer PCI loans (carrying value) 19,190 69 — — — 19,259
Total consumer loans $ 273,869 53,004 34,039 59,966 39,098 459,976
December 31, 2014
By delinquency status:
Current-29 DPD $ 208,642 58,182 30,356 54,365 35,356 386,901
30-59 DPD 2,415 398 239 1,056 180 4,288
60-89 DPD 993 220 160 235 111 1,719
90-119 DPD 488 158 136 78 82 942
120-179 DPD 610 194 227 5 21 1,057
180+ DPD 4,258 464 1 1 13 4,737
Government insured/guaranteed loans (1) 26,268 — — — — 26,268
Total consumer loans (excluding PCI) 243,674 59,616 31,119 55,740 35,763 425,912
Total consumer PCI loans (carrying value) 21,712 101 — — — 21,813
Total consumer loans $ 265,386 59,717 31,119 55,740 35,763 447,725
(1) Represents loans whose repayments are predominantly insured by the FHA or guaranteed by the VA. Loans insured/guaranteed by the FHA/VA and 90+ DPD totaled
$12.4 billion at December 31, 2015, compared with $16.2 billion at December 31, 2014.
Of the $5.5 billion of consumer loans not government
insured/guaranteed that are 90 days or more past due at
December 31, 2015, $867 million was accruing, compared with
$6.7 billion past due and $873 million accruing at December 31,
2014.
Real estate 1-4 family first mortgage loans 180 days or more
past due totaled $3.4 billion, or 1.3% of total first mortgages
(excluding PCI), at December 31, 2015, compared with
$4.3 billion, or 1.7%, at December 31, 2014.
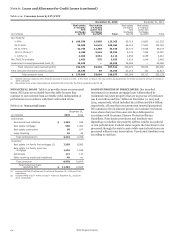
Table 6.11 provides a breakdown of our consumer portfolio
by updated FICO. We obtain FICO scores at loan origination and
the scores are updated at least quarterly. The majority of our
portfolio is underwritten with a FICO score of 680 and above.
FICO is not available for certain loan types and may not be
obtained if we deem it unnecessary due to strong collateral and
other borrower attributes, primarily security-based loans of
$7.0 billion at December 31, 2015, and $5.9 billion at
December 31, 2014.
Wells Fargo & Company
168